authorized crew only
sequence XB-900
People accumulate meaningful life events across decades, but there is no reliable way to document, revisit, or understand those events as a coherent whole. Existing tools are media-first, performative, and impose rigid time structures that break down against real lived experience.
I led this project end-to-end as a solo designer, using AI as an accelerant while defining the product vision and interaction model. My responsibilities included framing the problem, designing the temporal model and data relationships, establishing an intent-driven AI workflow, designing and implementing the UI across complex interdependent screens, and creating internal tools for diagnostics, validation, and behavioral system management.
Built within an AI-assisted development environment with deliberate constraints — AI tools were directed through intent and guardrails, data storage was intentionally deferred during early prototyping until the model stabilized, and functionality was modularized as interdependencies grew. Once stable, the system was migrated to a production backend: Firebase Auth for user identity, Firestore for per-user data isolation, and Cloud Functions for API key management.
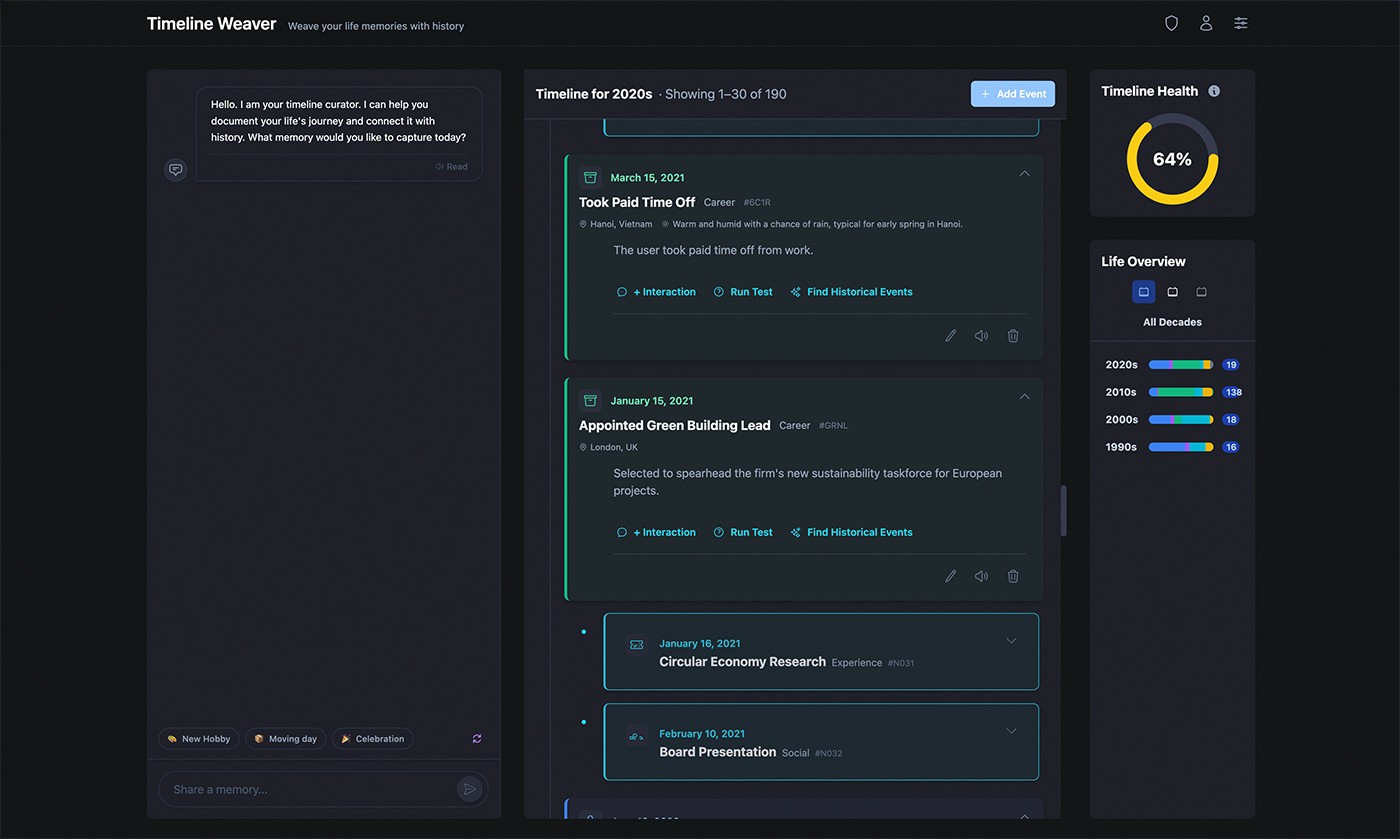
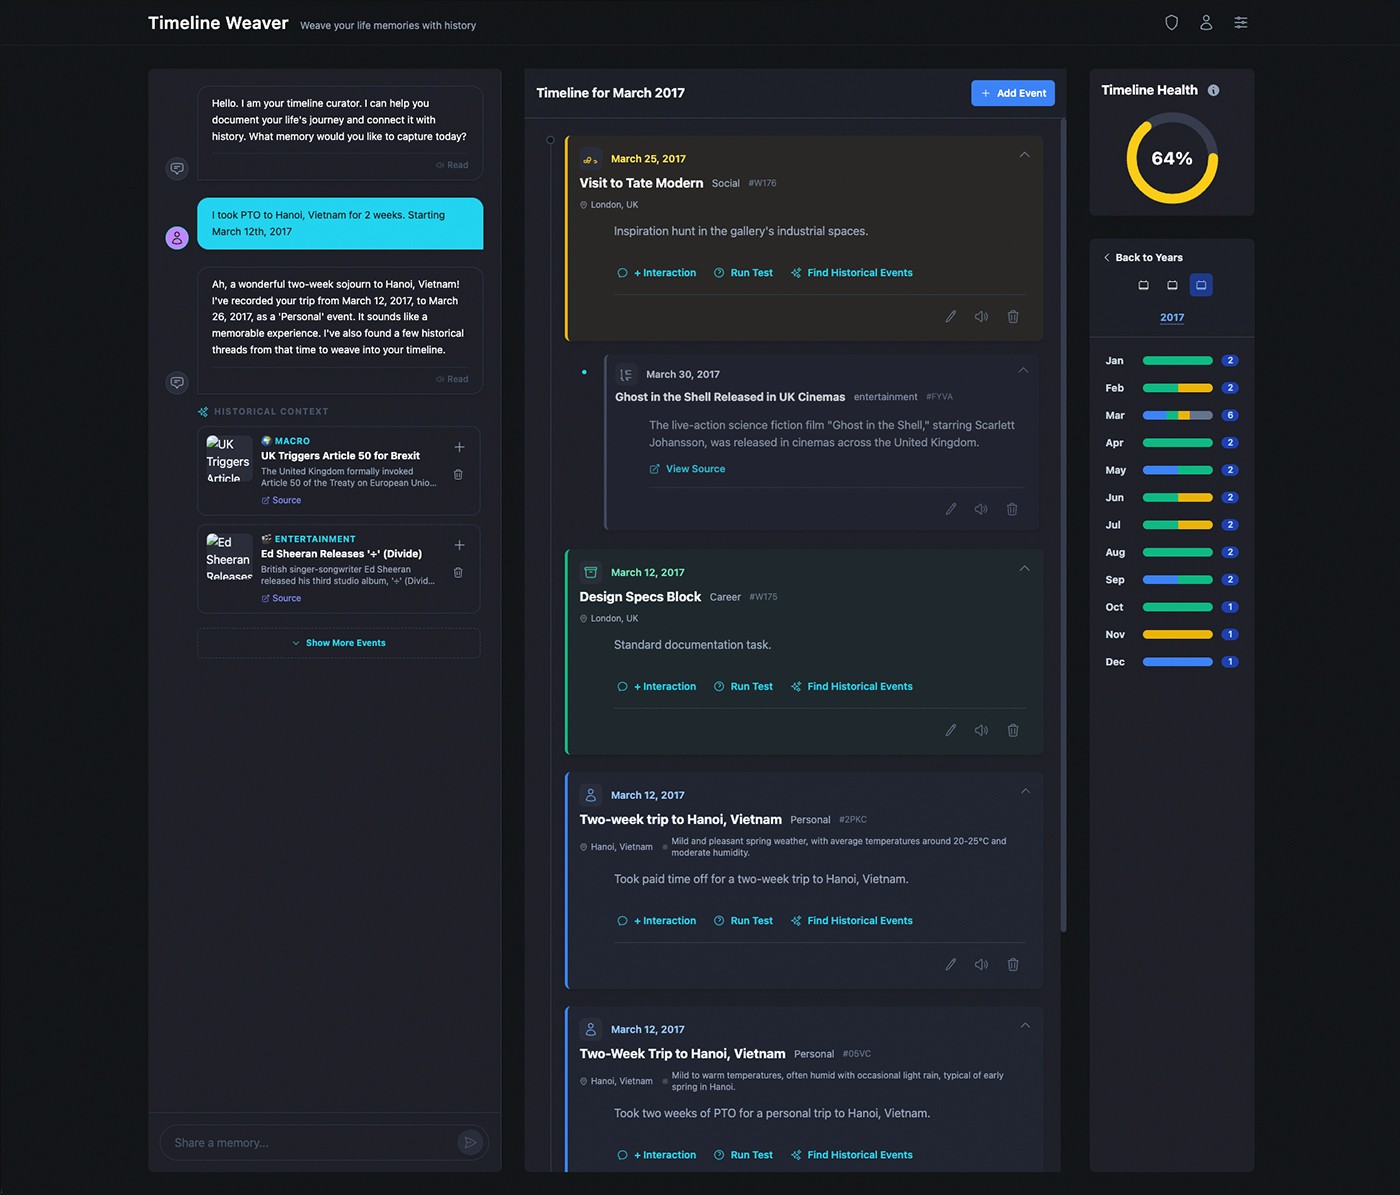
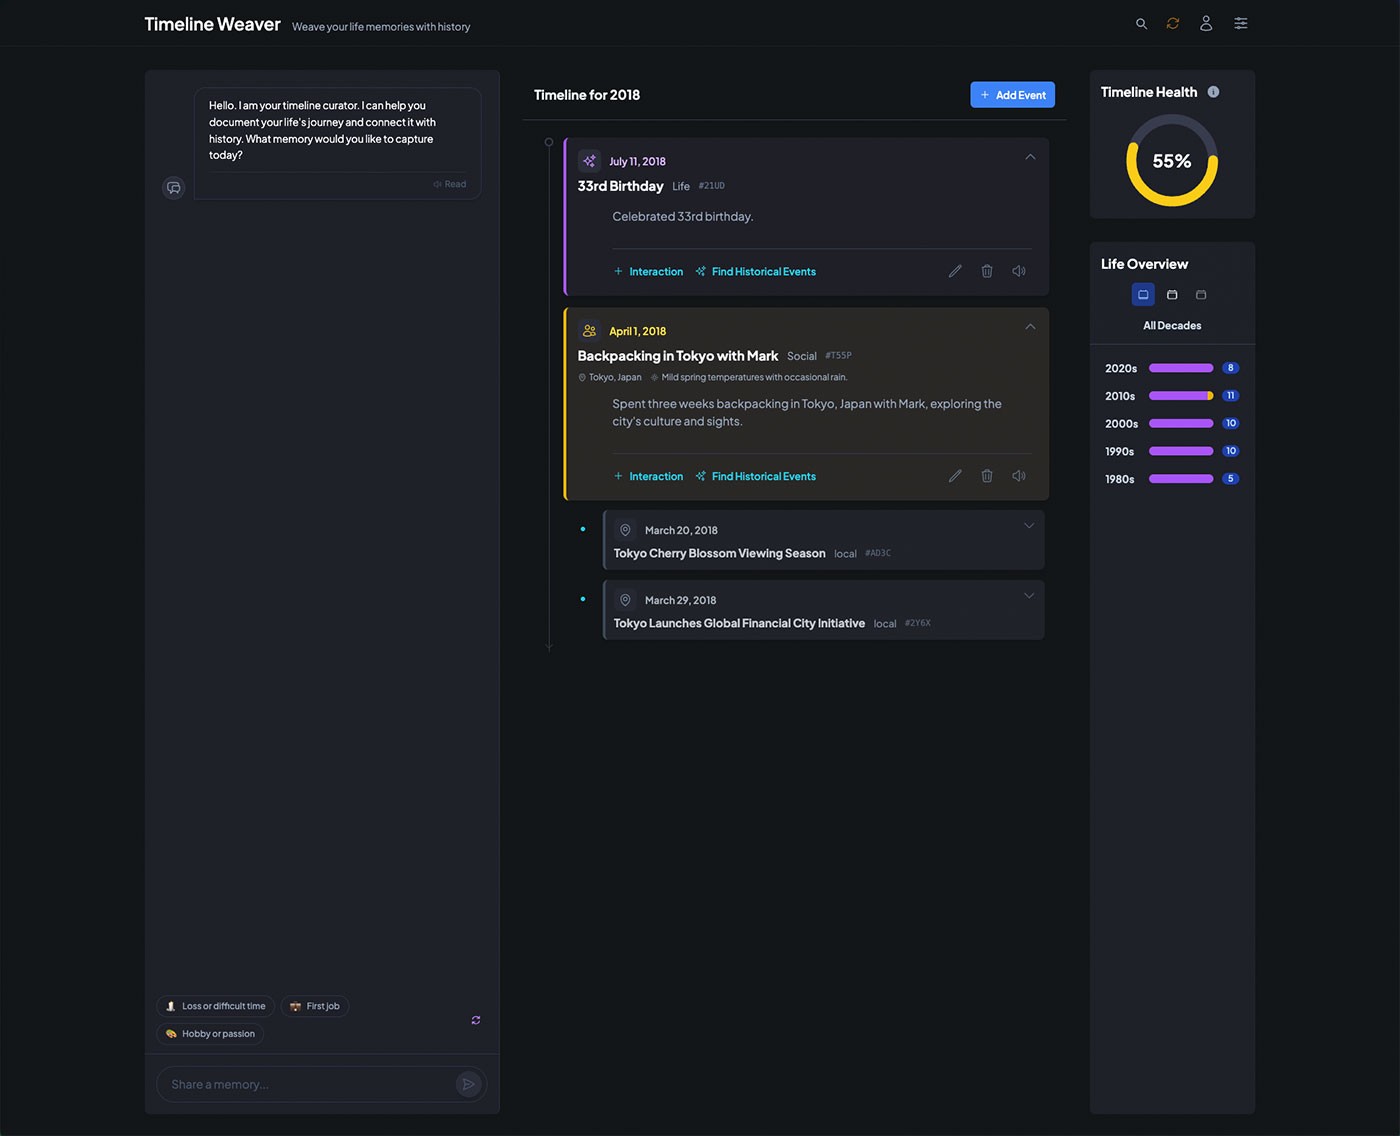
FigLife events are modeled as connected entries within a multi-scale timeline.
The core challenge was not simply capturing life events, but representing them in a way that aligns with how experiences are actually remembered and understood over time. Most tools default to rigid, media-first or calendar-driven structures — optimized for posting, not for reflection.
Rather than treating this as a journaling or UI problem, I framed it as a structural design problem. The issue was a mismatch between how tools impose structure and how people naturally recall and relate events. This framing exposed underlying tensions: between fixed timestamps and evolving memories, isolated entries and connected experiences, public artifacts and private context.
By defining the multi-scale timeline system first, I established how events could span moments, ranges, and life phases without forcing artificial precision. This allowed later interface and interaction decisions to consistently reflect how people actually remember experiences over time.
FigStructural tensions that shaped the system design — fixed timestamps vs. evolving memories, isolation vs. connection.
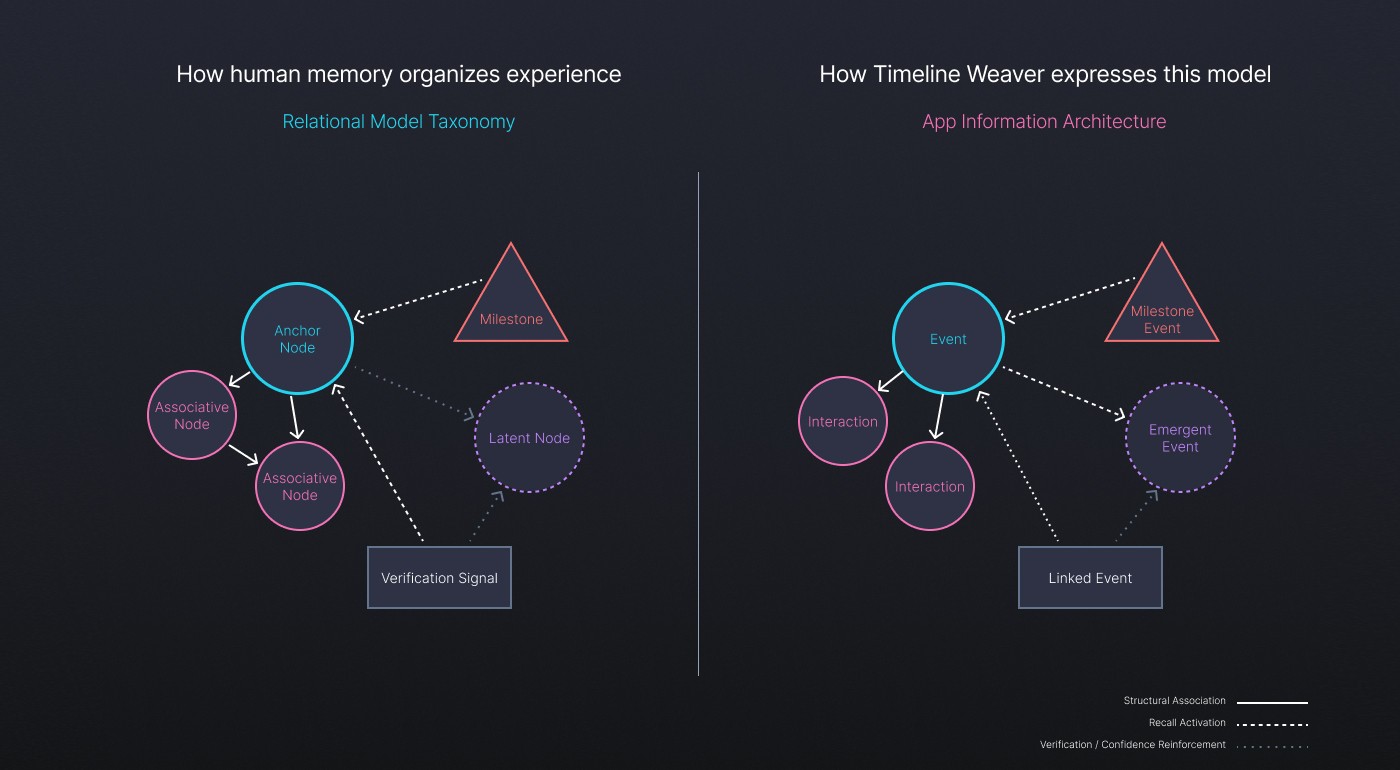
Rather than starting with interface patterns, the system was guided by structural principles grounded in how people actually recall experiences over time. Events needed to support ambiguity, evolve without being rewritten, and remain meaningful even when details were incomplete.
At the core is a multi-scale timeline model that allows events to exist at different levels of precision — a single moment, a multi-day experience, or an extended life phase — without forcing artificial boundaries. Events can overlap, relate to one another, and be revisited as understanding changes.
By aligning the system model with how memories naturally form and resurface, the timeline supports reflection instead of performance. Users can add meaning gradually, connect experiences across years, and surface patterns without reorganizing data.
FigEvent scale model, context accumulation, capture-refinement stages, and the full system model forming the core architecture.
With the system model established, the focus shifted to how users would engage with it day-to-day. The goal was not efficiency through compression, but clarity through progressive disclosure — allowing users to add, revisit, and refine events without needing to decide everything upfront.
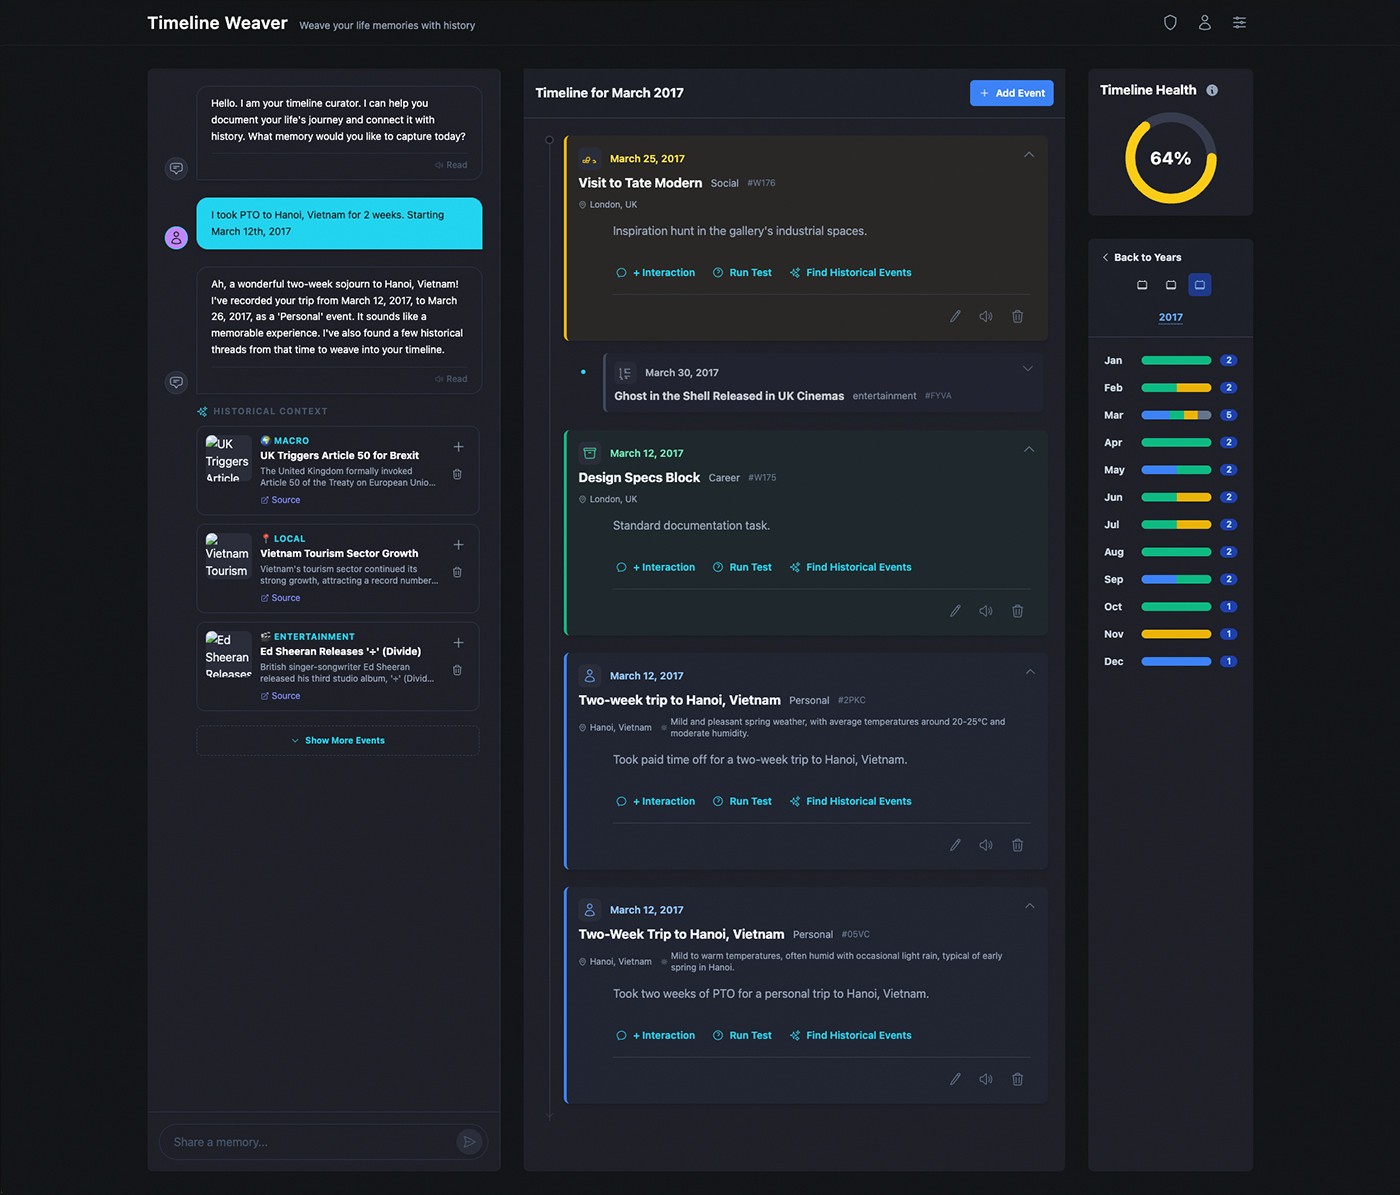
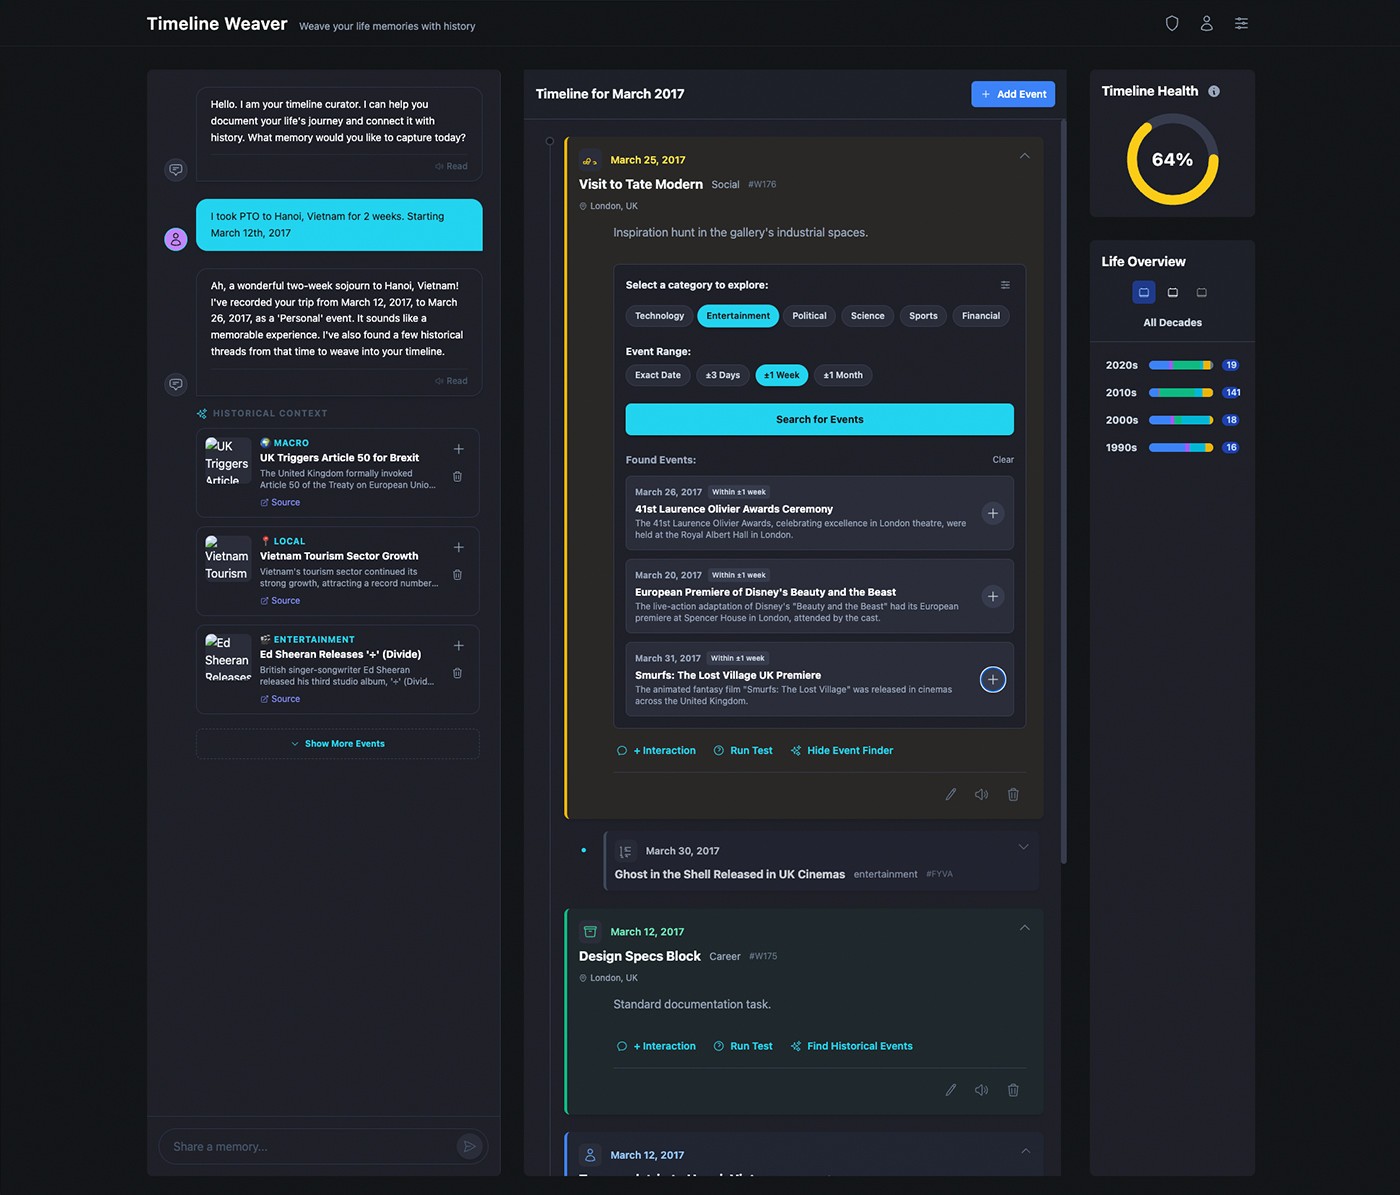
Interactions were designed to feel conversational and permissive, supporting partial inputs, evolving meaning, and later refinement. The primary workflow centered on capturing an experience as it was remembered: add events with minimal initial detail, revisit and expand as understanding evolved, connect events across time without reorganizing existing data.
Time was treated as an adjustable lens rather than a fixed constraint, allowing users to navigate fluidly between moments, spans, and phases as meaning evolved. This preserved momentum while preventing early decisions from constraining future reflection.
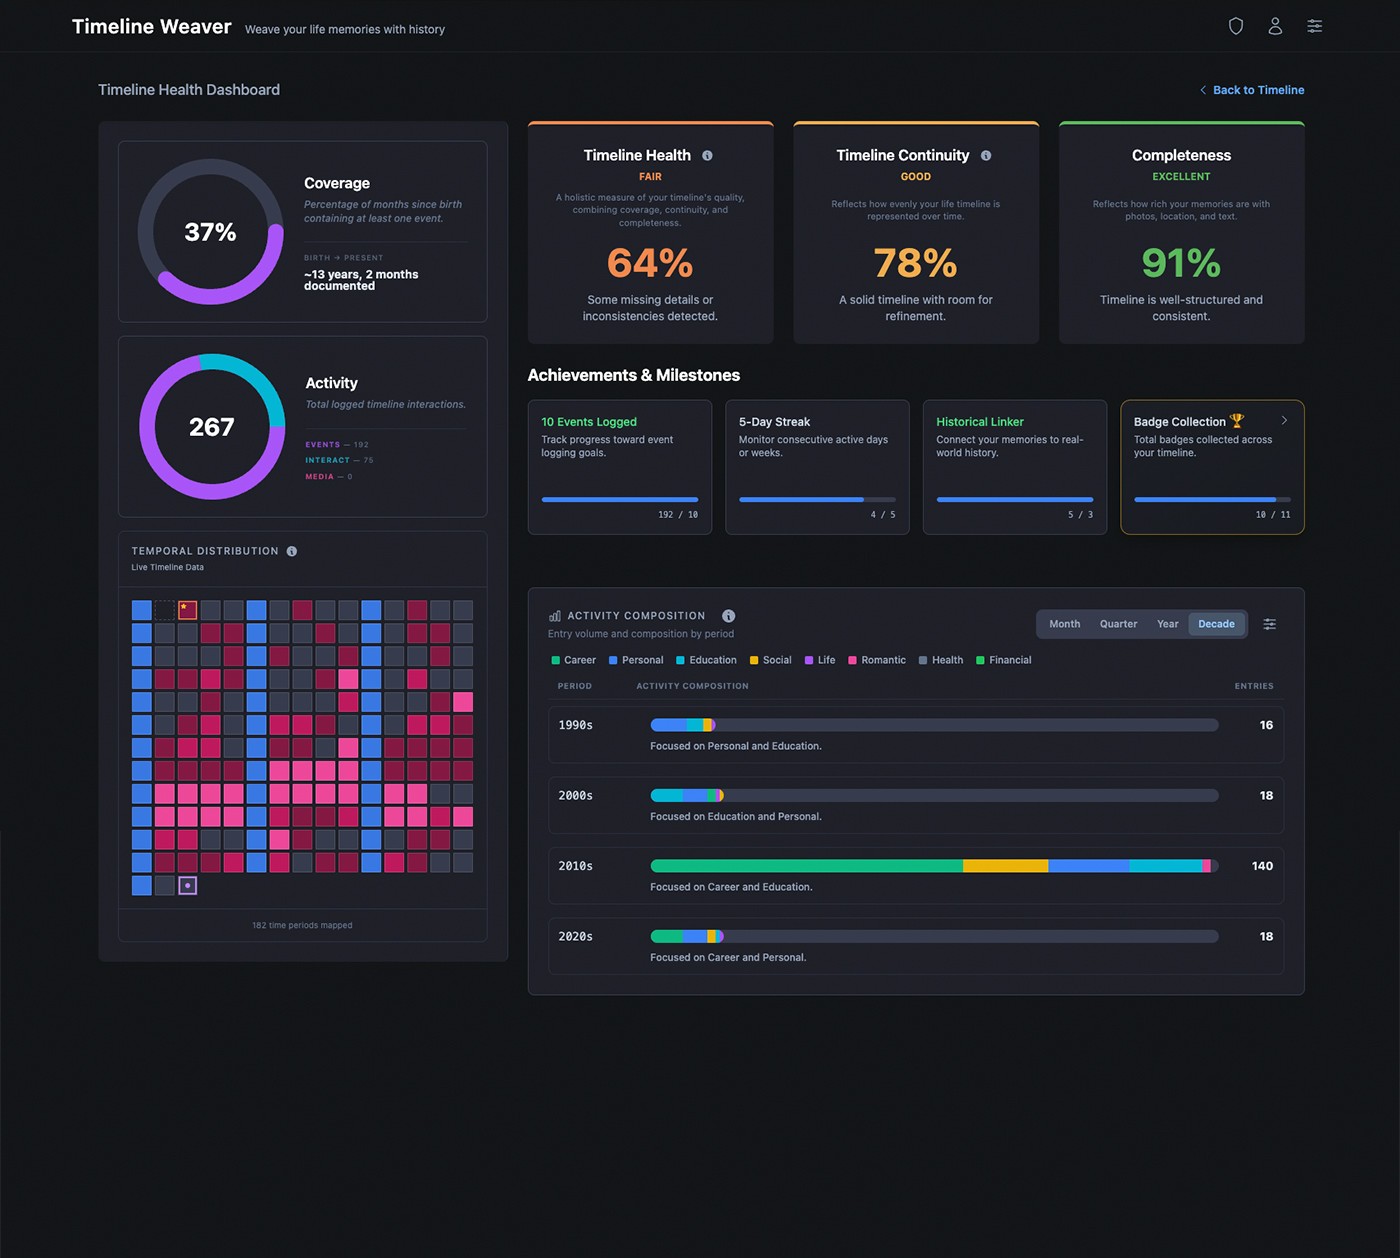
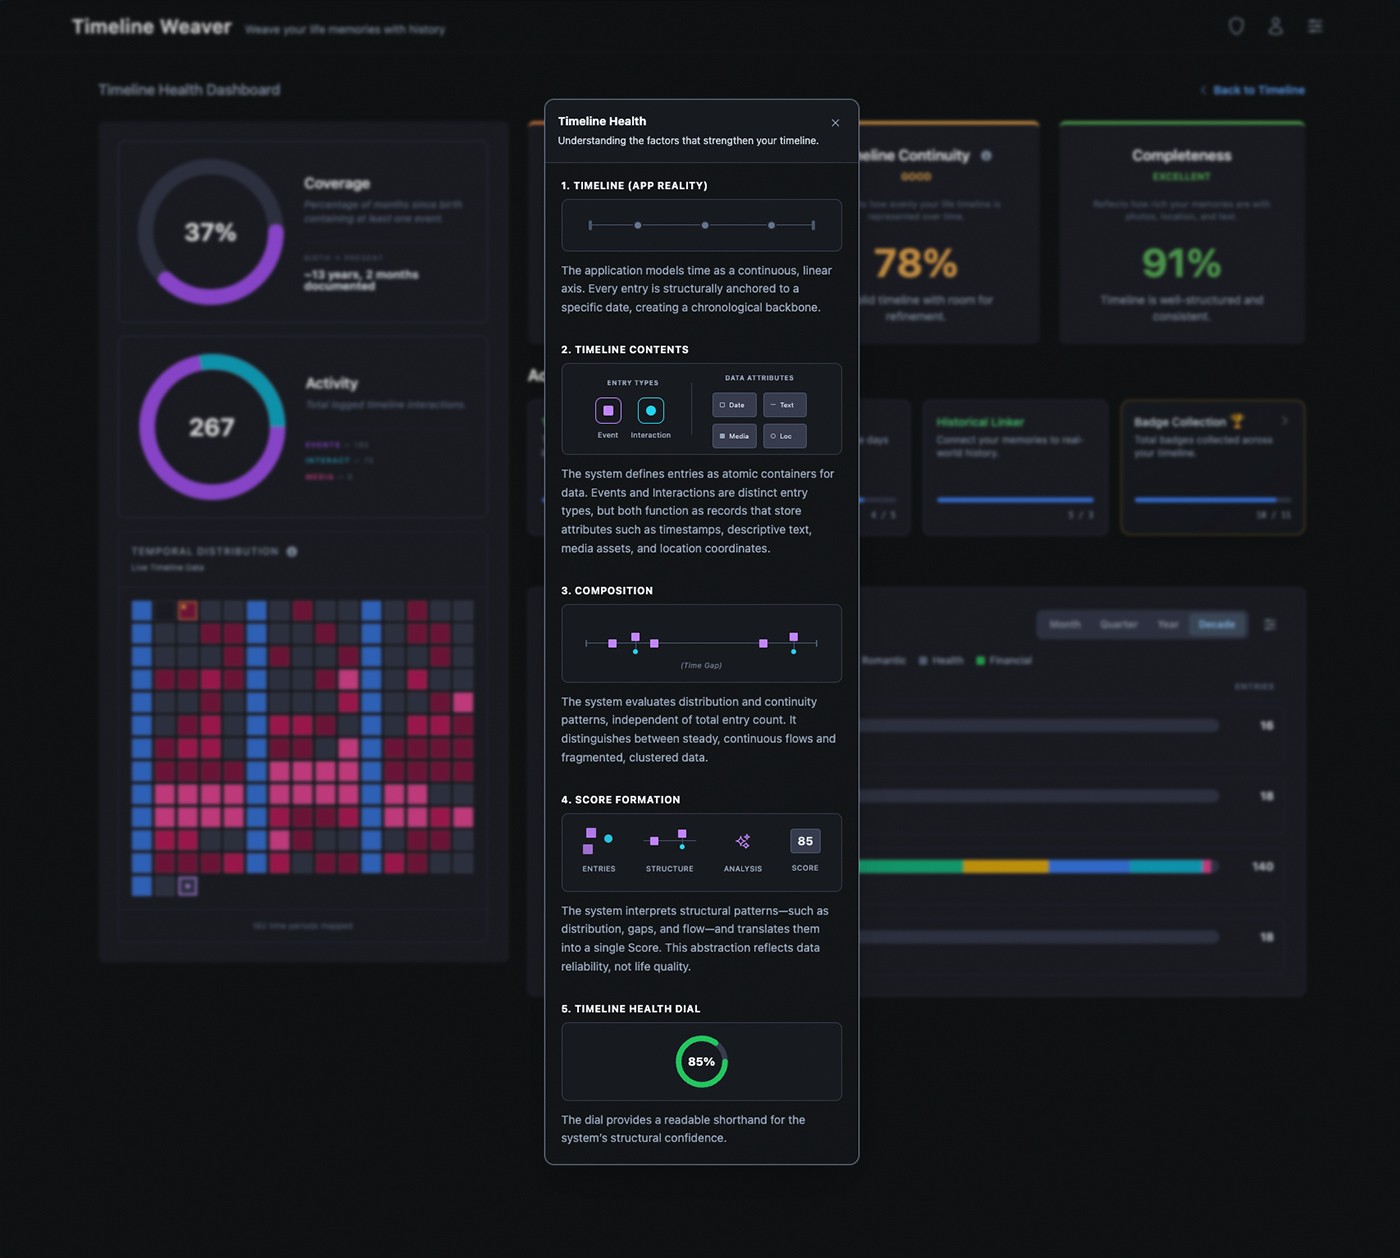
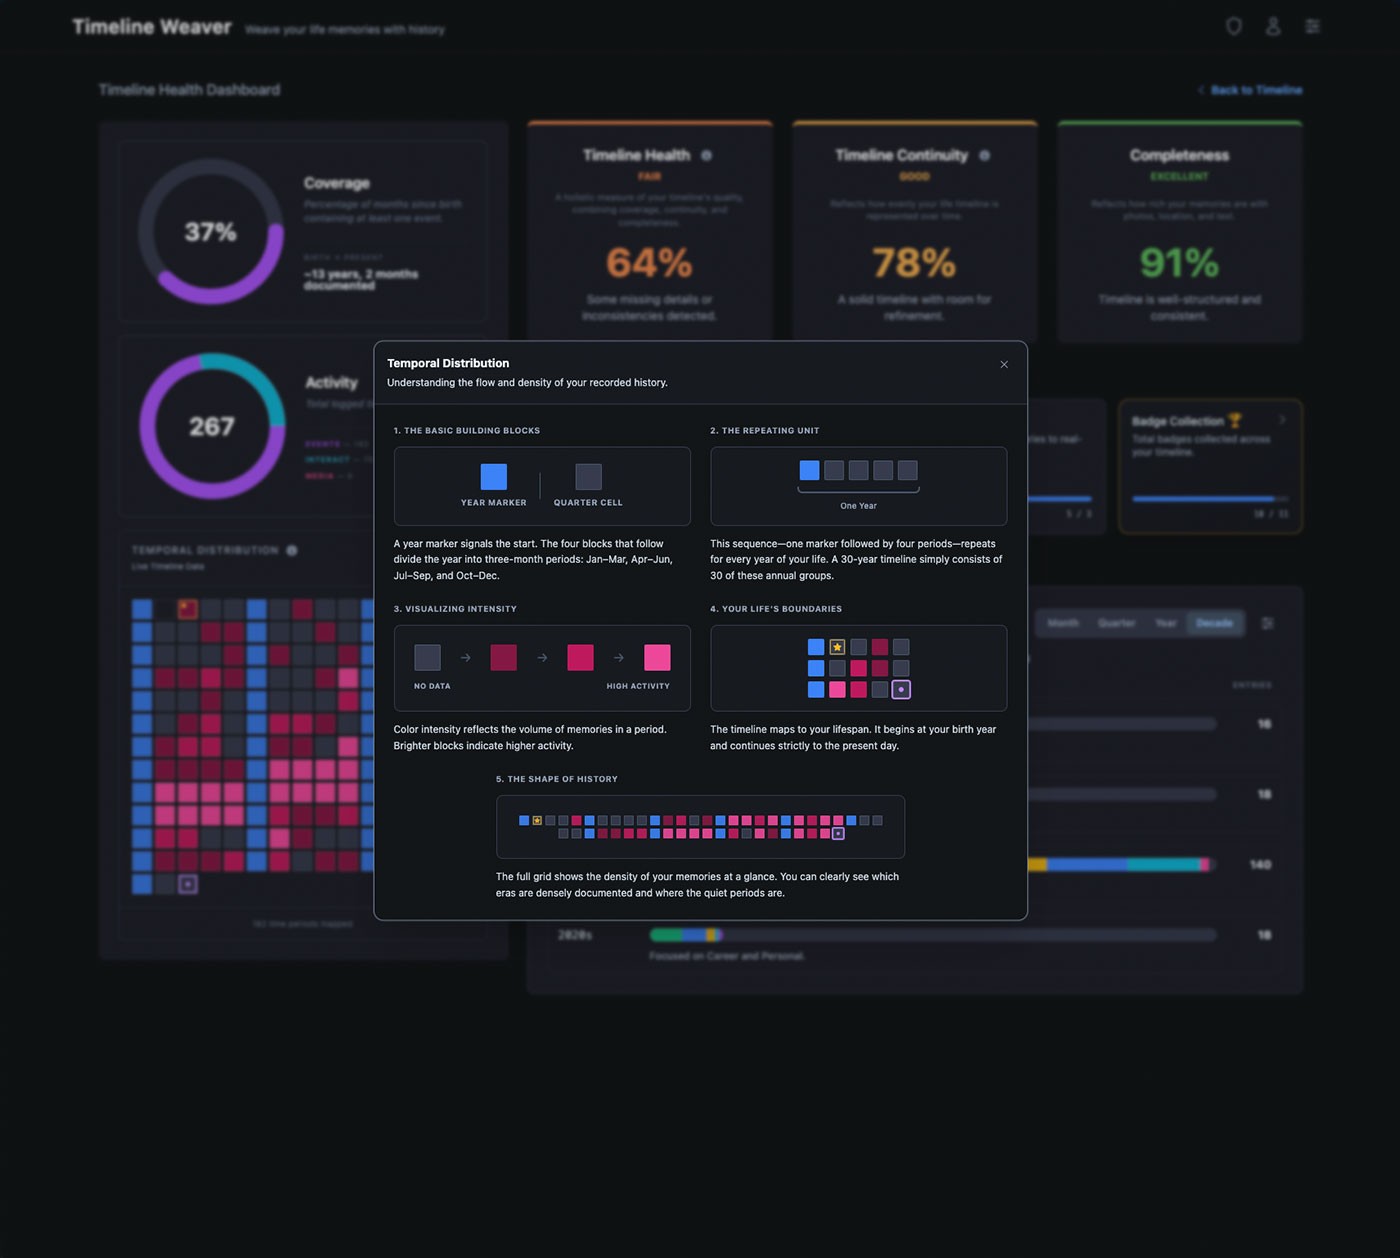
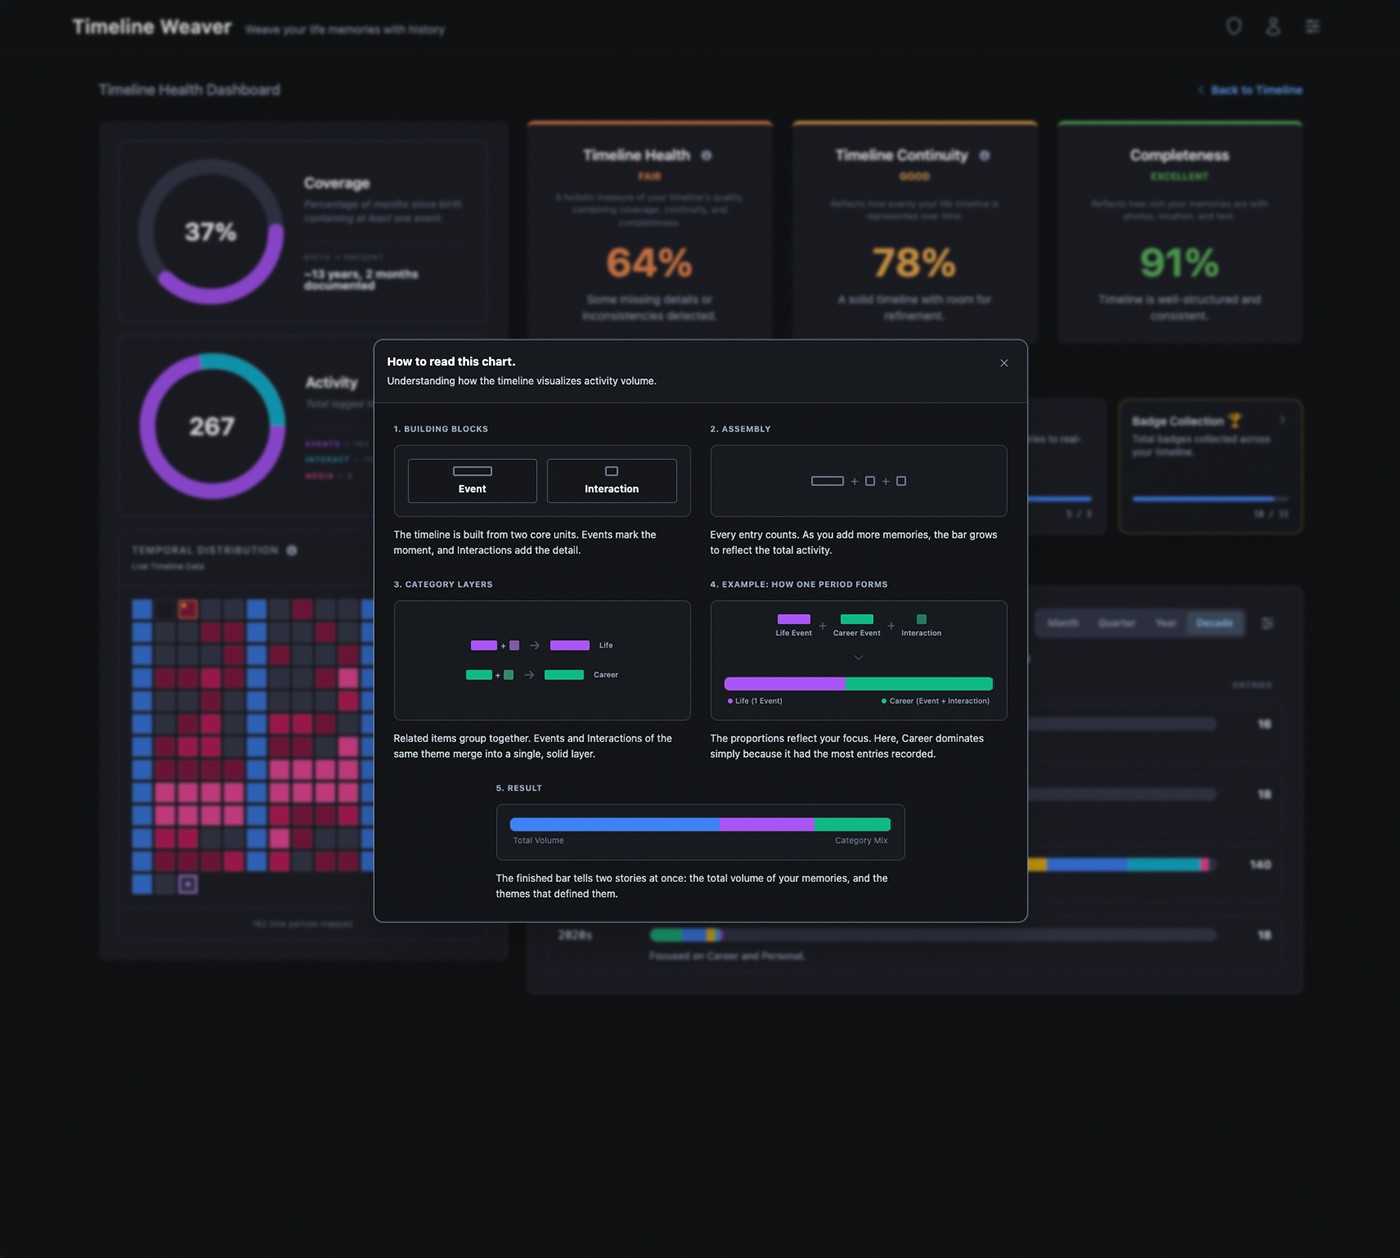
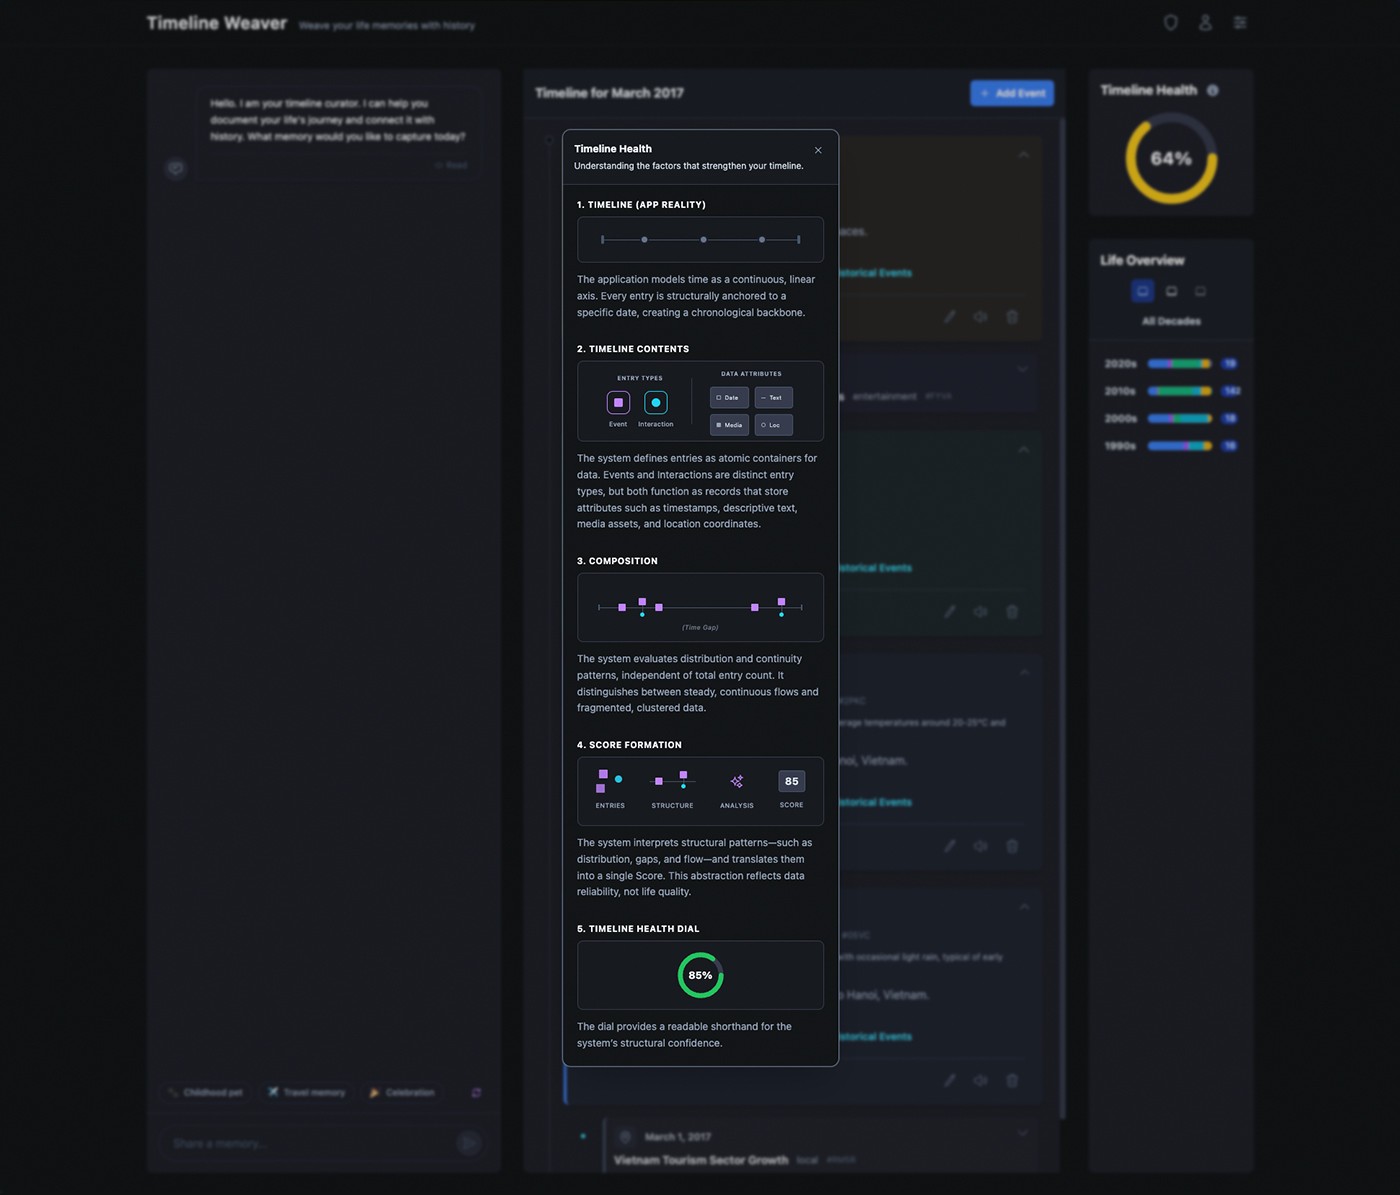
FigThe Timeline Health Dashboard tracks structural quality across coverage, continuity, and completeness — with hint overlays that explain each visualization in context.
Onboarding for a timeline product carries a specific risk: asking users to document meaningful life events before the system has demonstrated any value. A form-based setup sequence would front-load effort without context, producing low-quality entries or drop-off before the product had a chance to show what it could do.
The flow moved through name collection, birth date entry, an AI-powered question session, email registration, and timeline reveal — in that order. Each stage had a deliberate purpose: establish identity, seed the timeline with real events, create an account, and confirm the system had something meaningful to show before the user reached the main view. The birth date entry was consequential by design — on submission, the system immediately generated an anchor event and scaffolded annual birthday entries through to the present, giving the user a populated timeline before they had written a single memory.
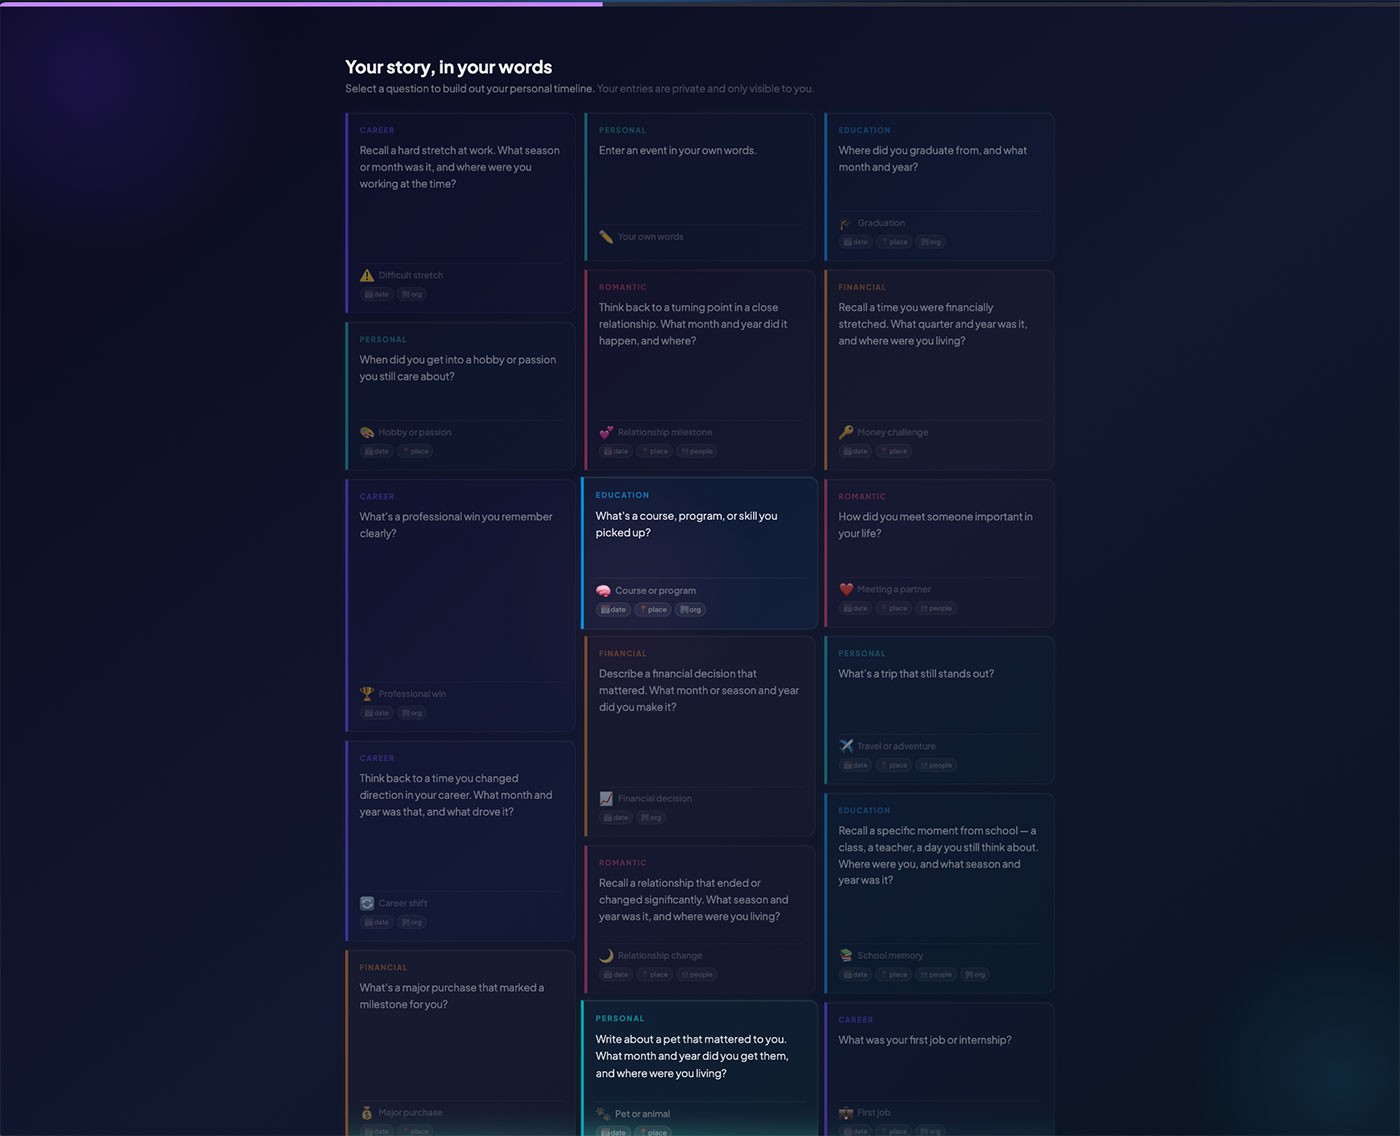
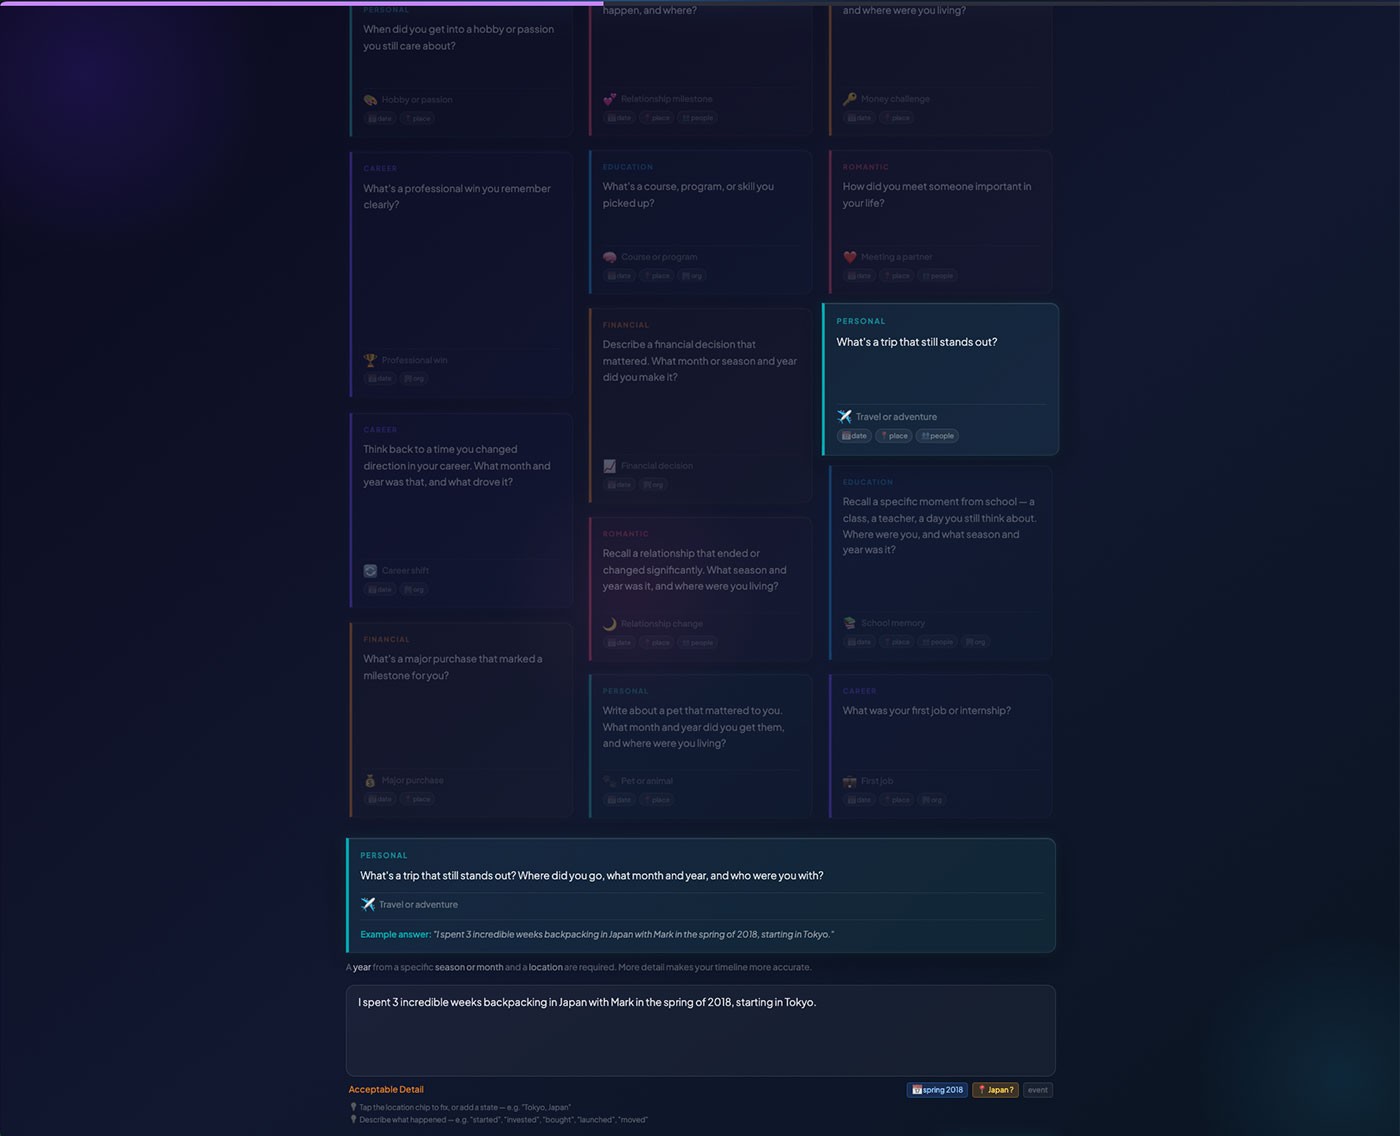
Stage 3 introduced the QuestionCardGrid — a full-screen immersive session presenting narrative prompts across seven life categories. Each answer was passed to the Gemini model, which extracted structured event data and committed it to the timeline in real time. The aesthetic developed here — Glass Night and Editorial, with frosted glass surfaces, per-category left-border color tokens, and ambient gradient depth — was intentionally tested in the onboarding context before being extended to the main timeline, making Stage 3 a live design trial under real usage conditions.
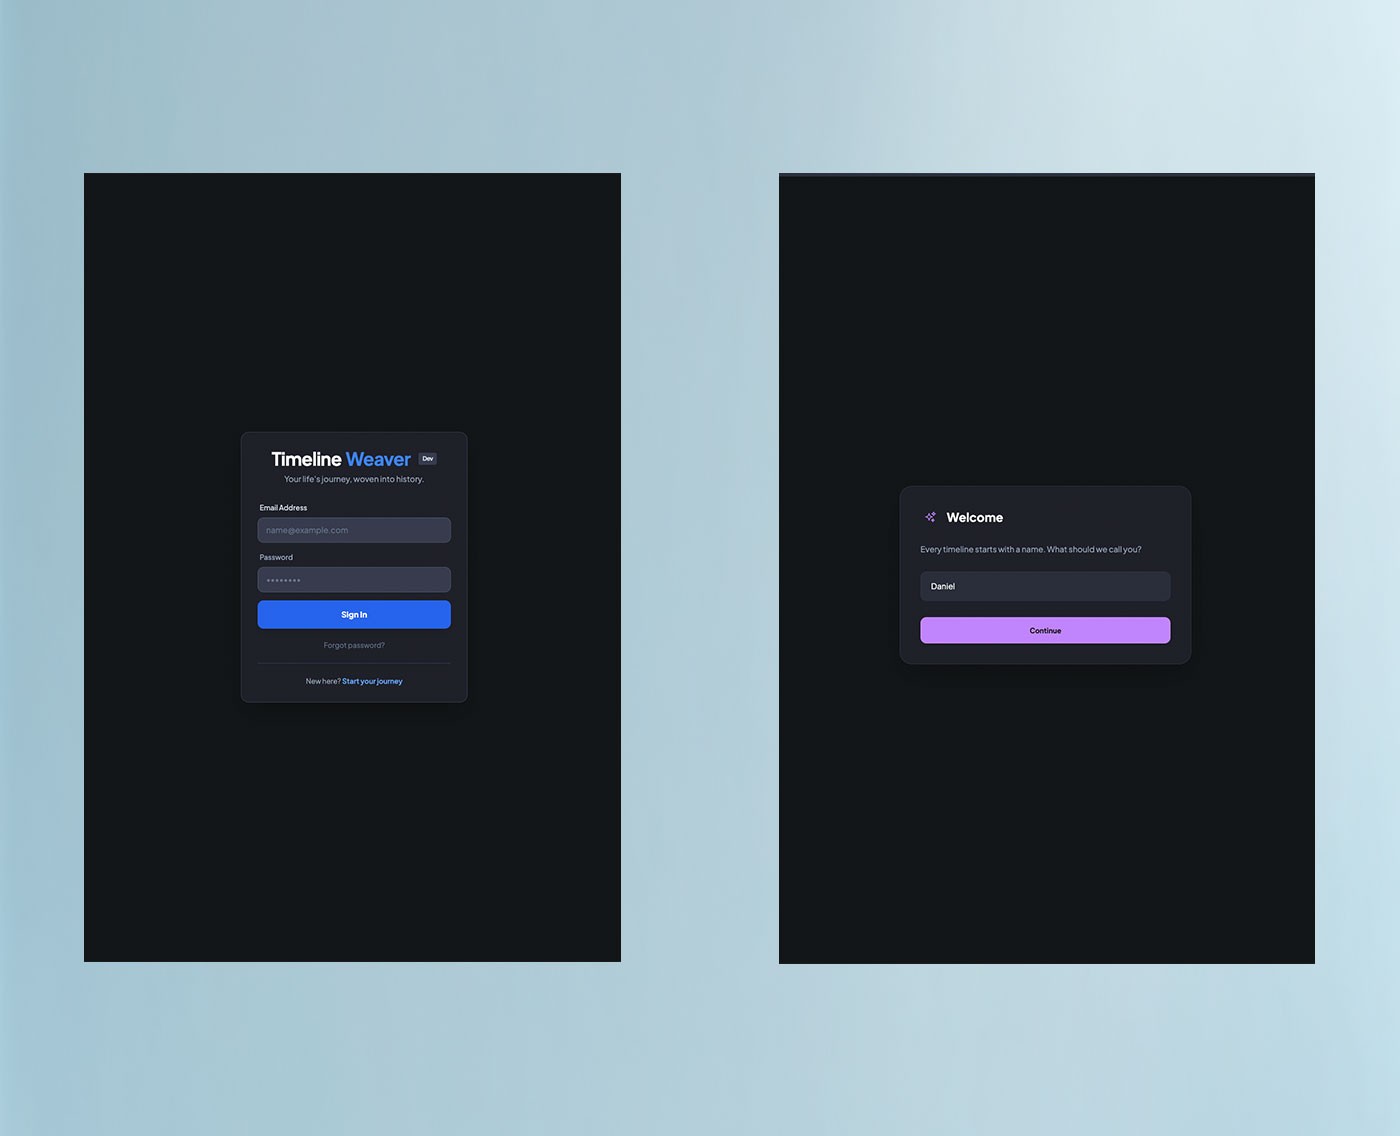
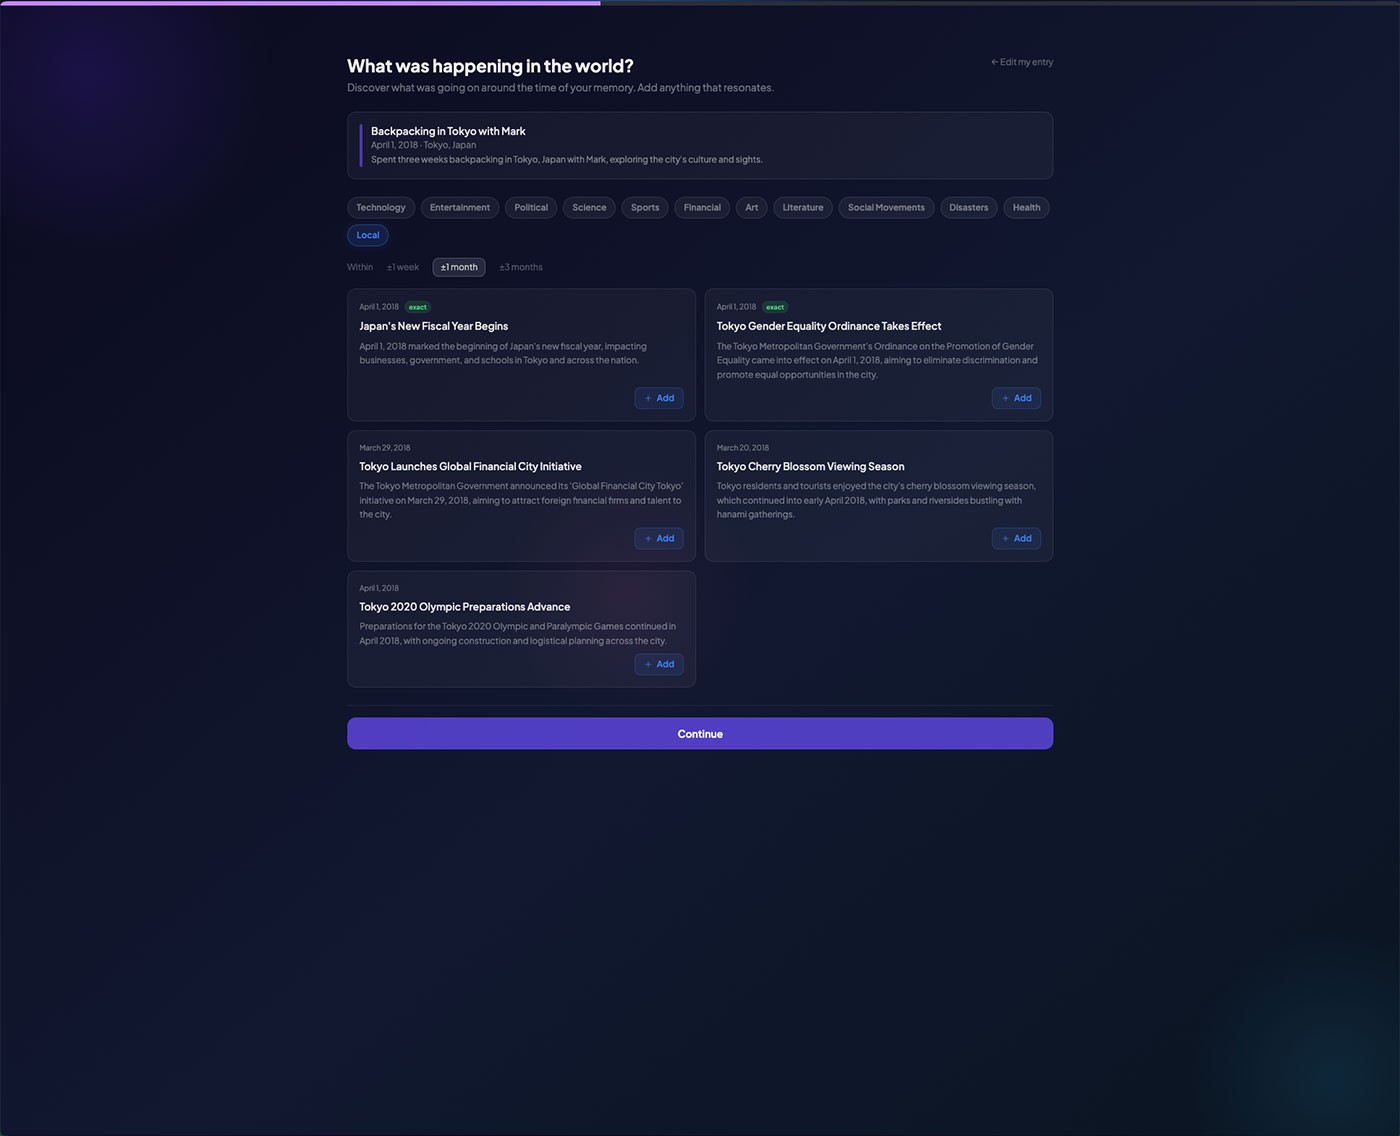
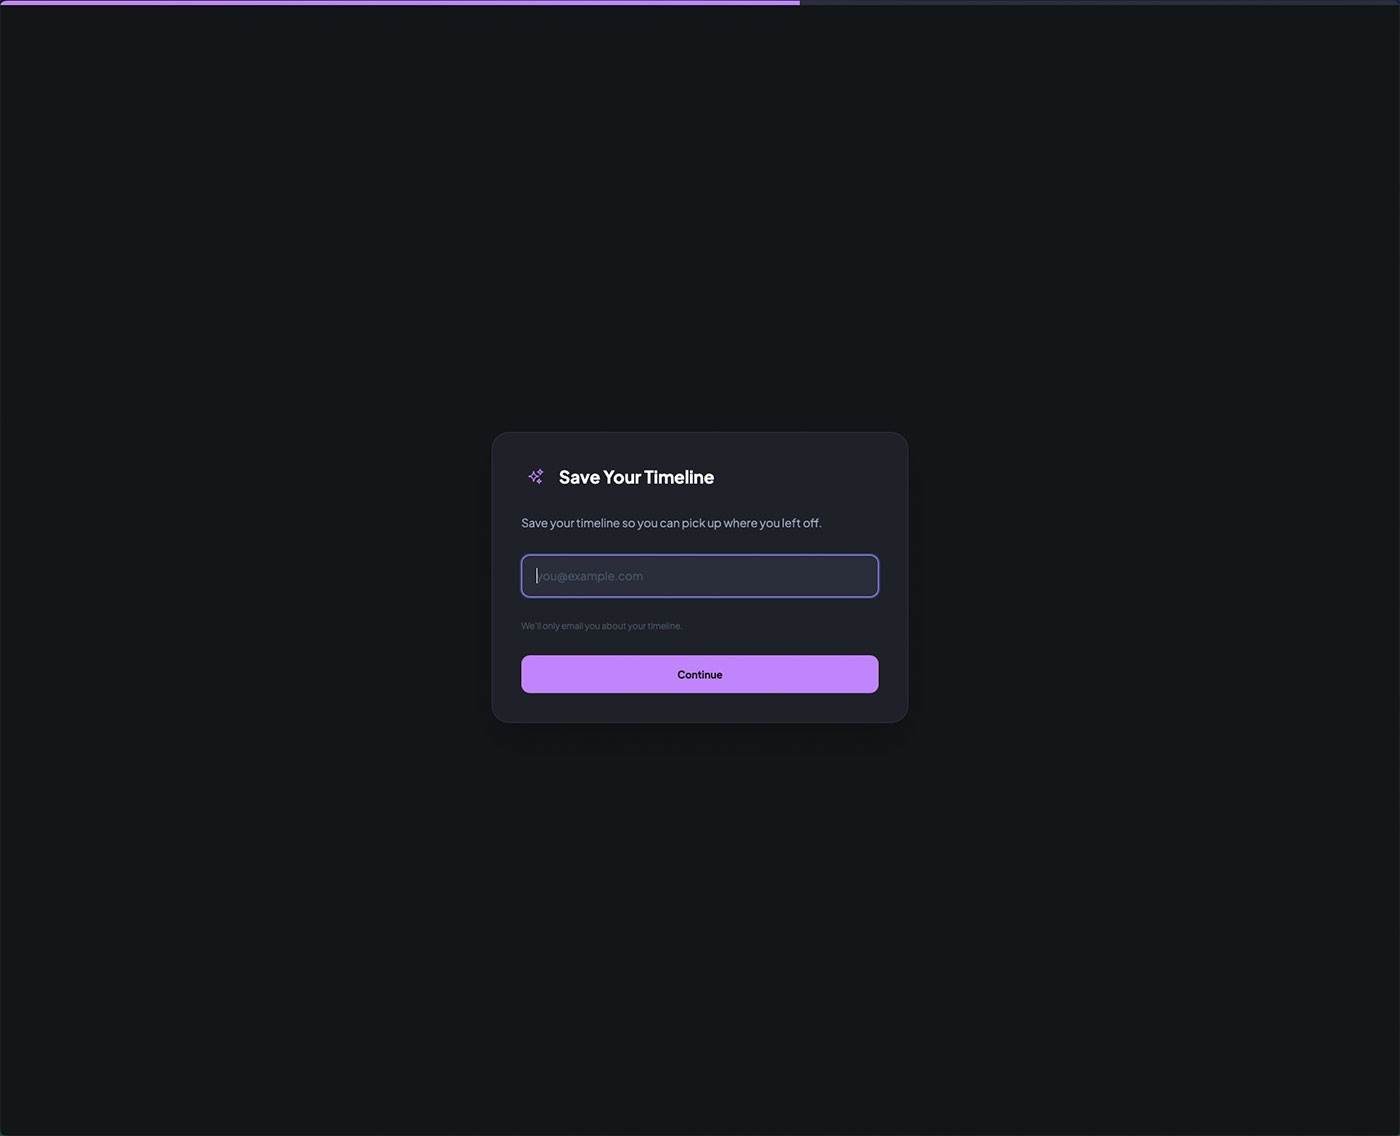
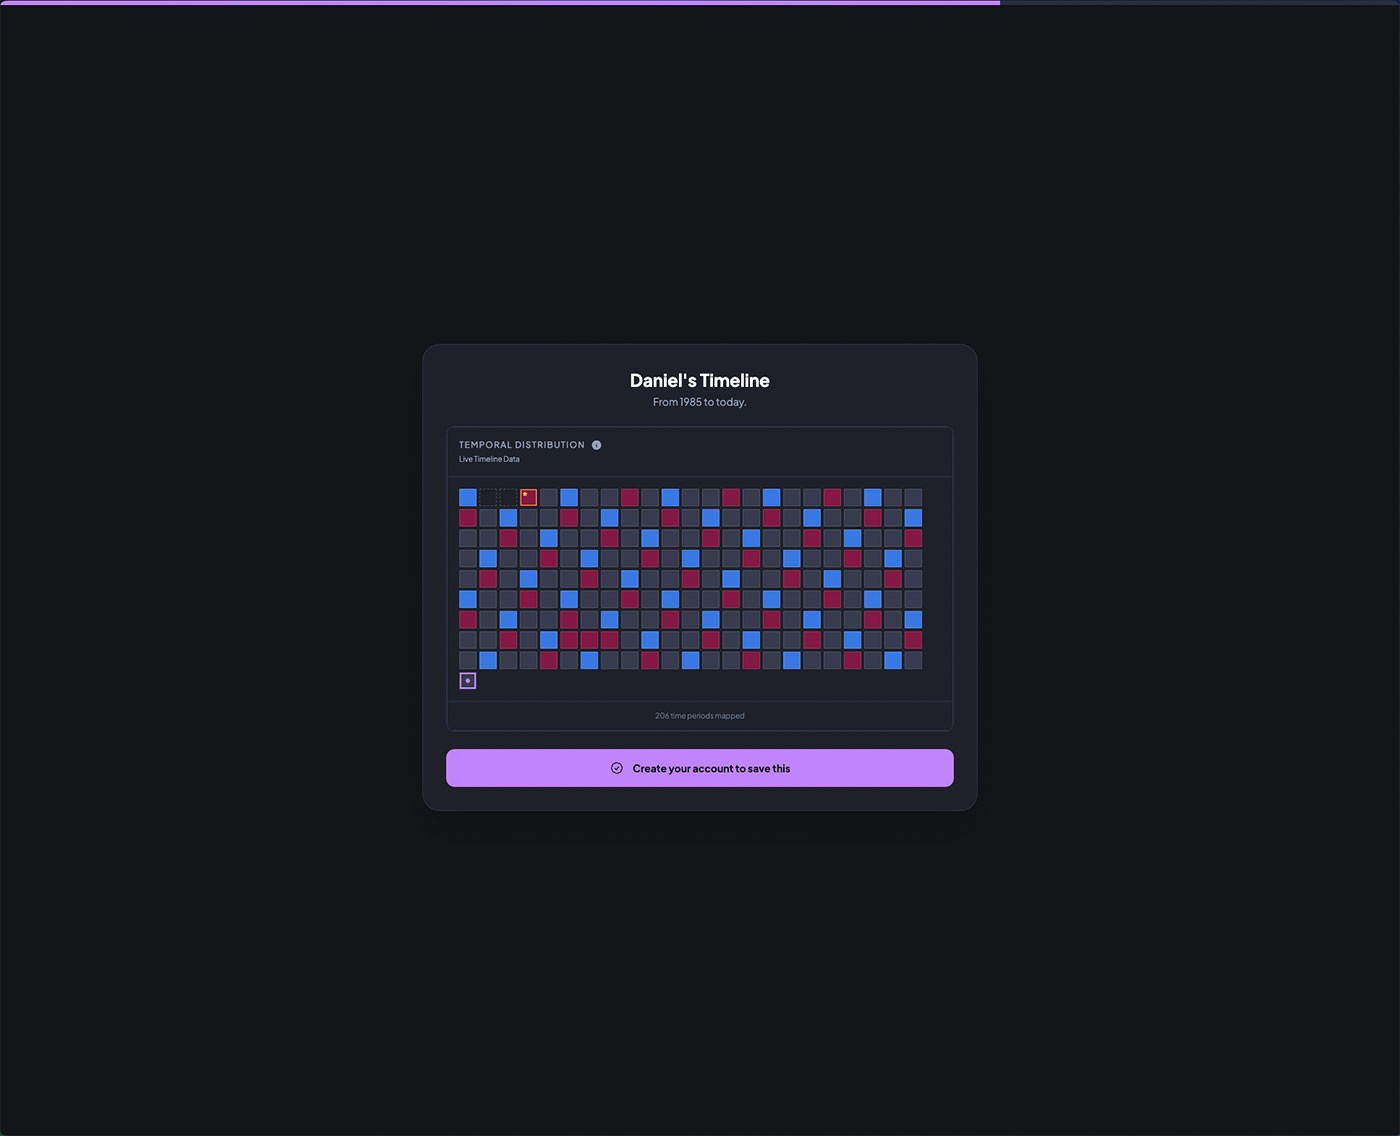
FigThe complete onboarding flow — from sign in and name entry through the QuestionCardGrid, world context enrichment, email capture, and timeline reveal. Account creation is deferred until the system has already demonstrated value.
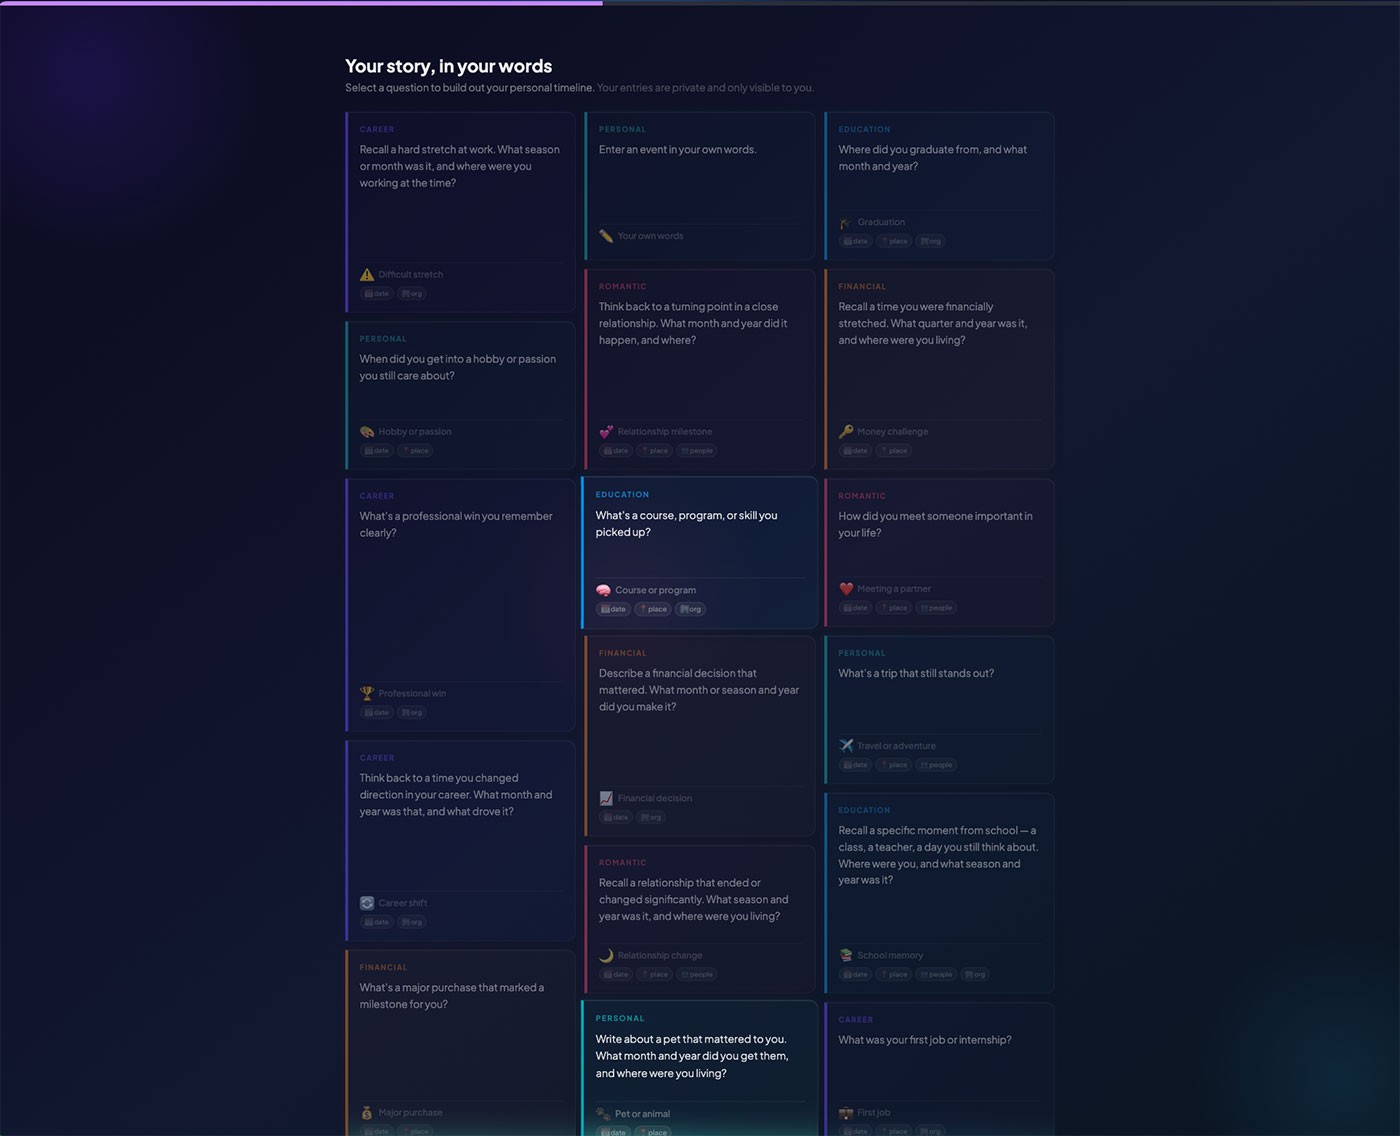
FigThe Stage 3 question card grid — full-screen immersive layout with frosted glass cards, category-specific color tokens, and ambient depth. The grid functions as both a design trial and a live AI entry point.
Once the system moved beyond early modeling, the primary risk became structural drift — whether overlapping events, interactions, and growing data volume would introduce edge cases, special rules, or unintended dependencies over time.
Validation happened through continued use rather than staged testing. As real events accumulated, structural assumptions were monitored for stress points. Diagnostics were introduced selectively once the data shape stabilized, focusing on areas where compounding complexity could surface hidden issues.
The system remained consistent as complexity increased. Events and interactions preserved their relationships, connected views stayed synchronized, and derived metrics reflected underlying data accurately — confirming the system's ability to scale without corrective workflows or structural exceptions.
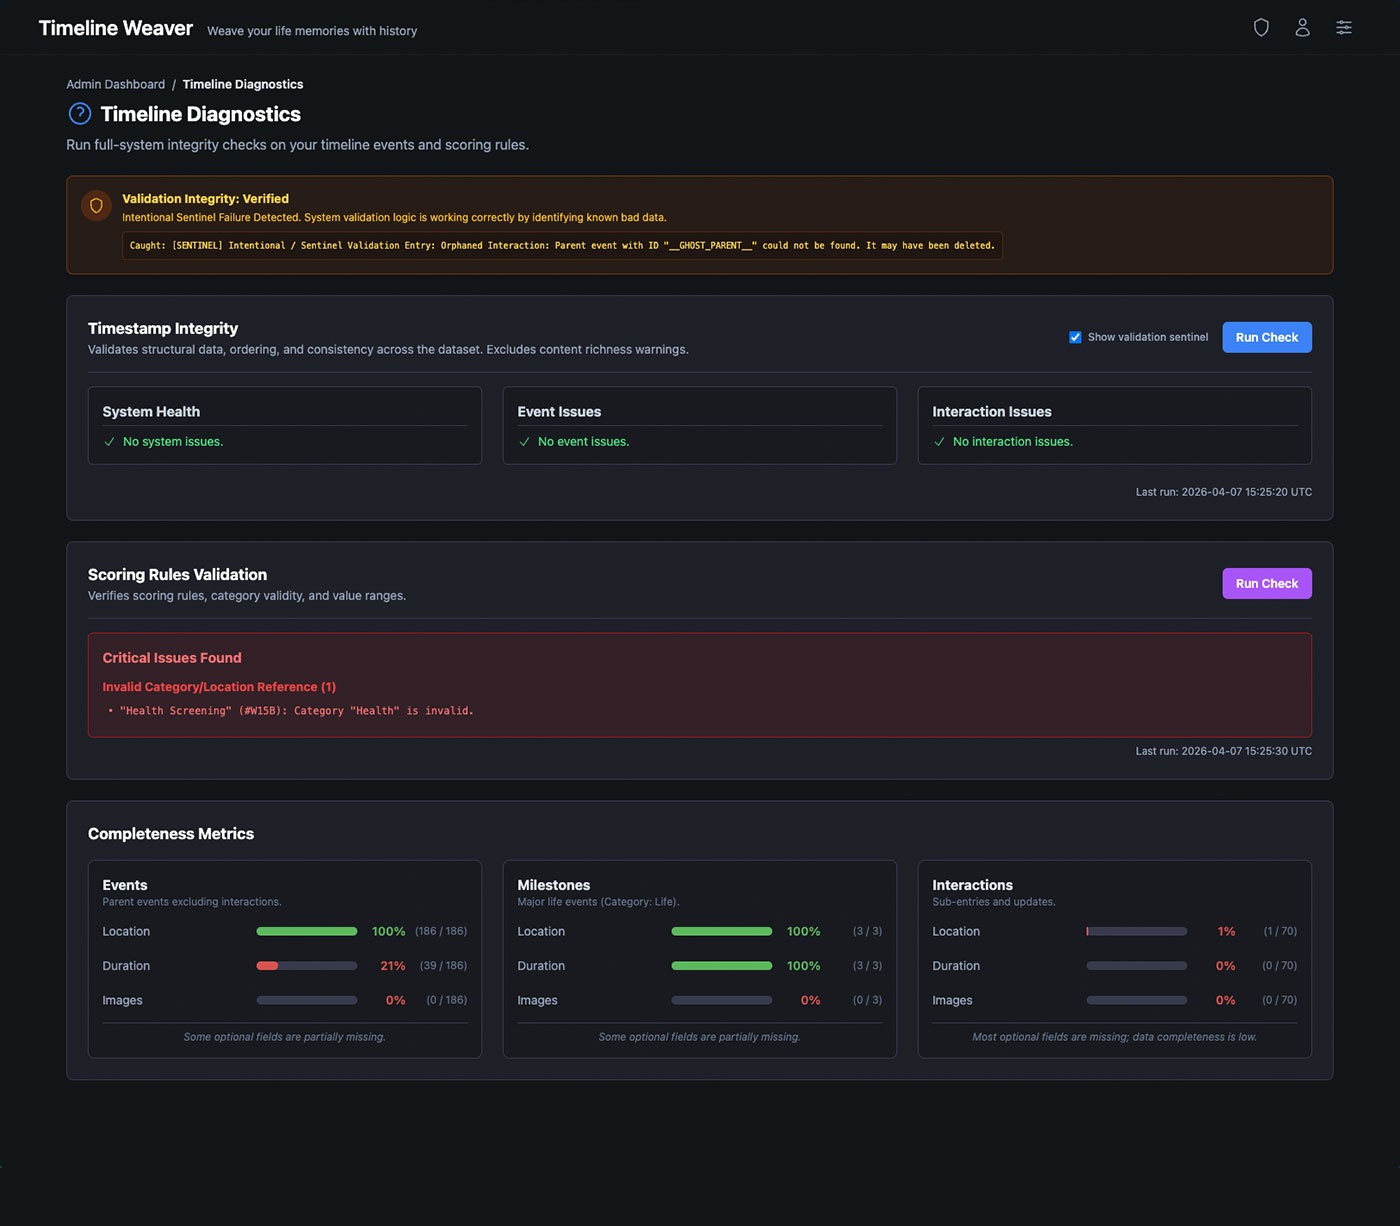
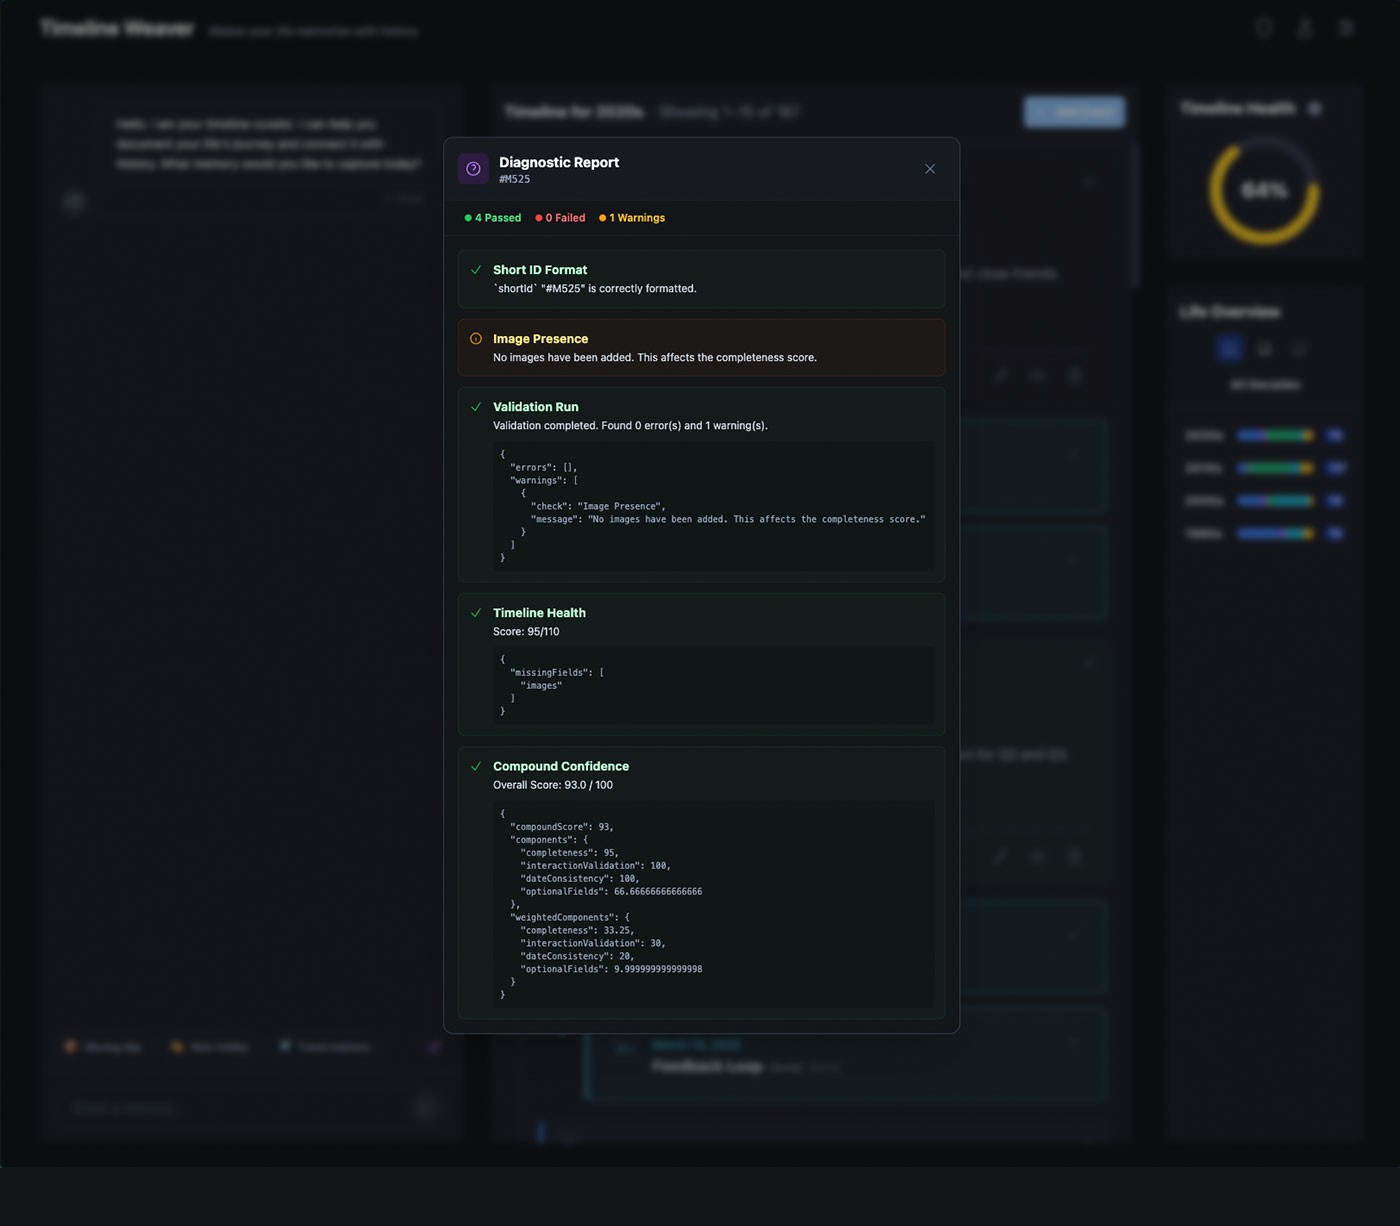
FigDiagnostics confirmed structural integrity held as data accumulated — from system-wide checks down to per-entry validation and confidence scoring.
As timelines grew, the challenge shifted from adding information to maintaining clarity. Without synthesis, accumulating events can fragment understanding and increase cognitive effort. The system needed to scale without increasing the cognitive effort required to keep past events coherent.
The timeline was designed so understanding develops over time rather than being forced upfront. Temporal structure, related events, and connected views allowed partial or uncertain memories to be reinforced through association. As more information was added, context accumulated naturally — helping events gain clarity through their relationships rather than isolated entries.
Users could navigate across multiple time scales, recognize patterns, and refine memories without constant reorganization. The timeline removed the need for perfect organization, allowing understanding to emerge over time through connected events and relationships.
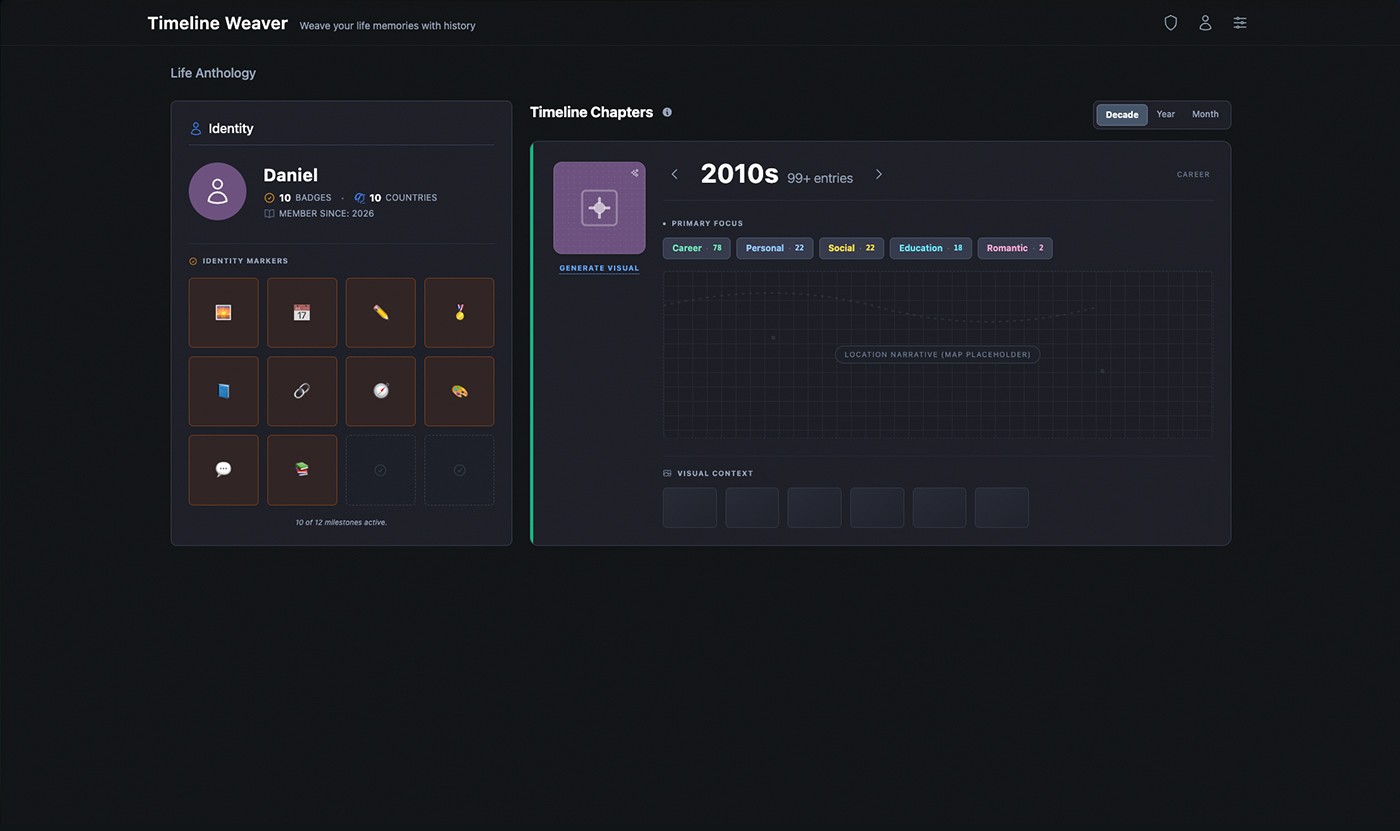
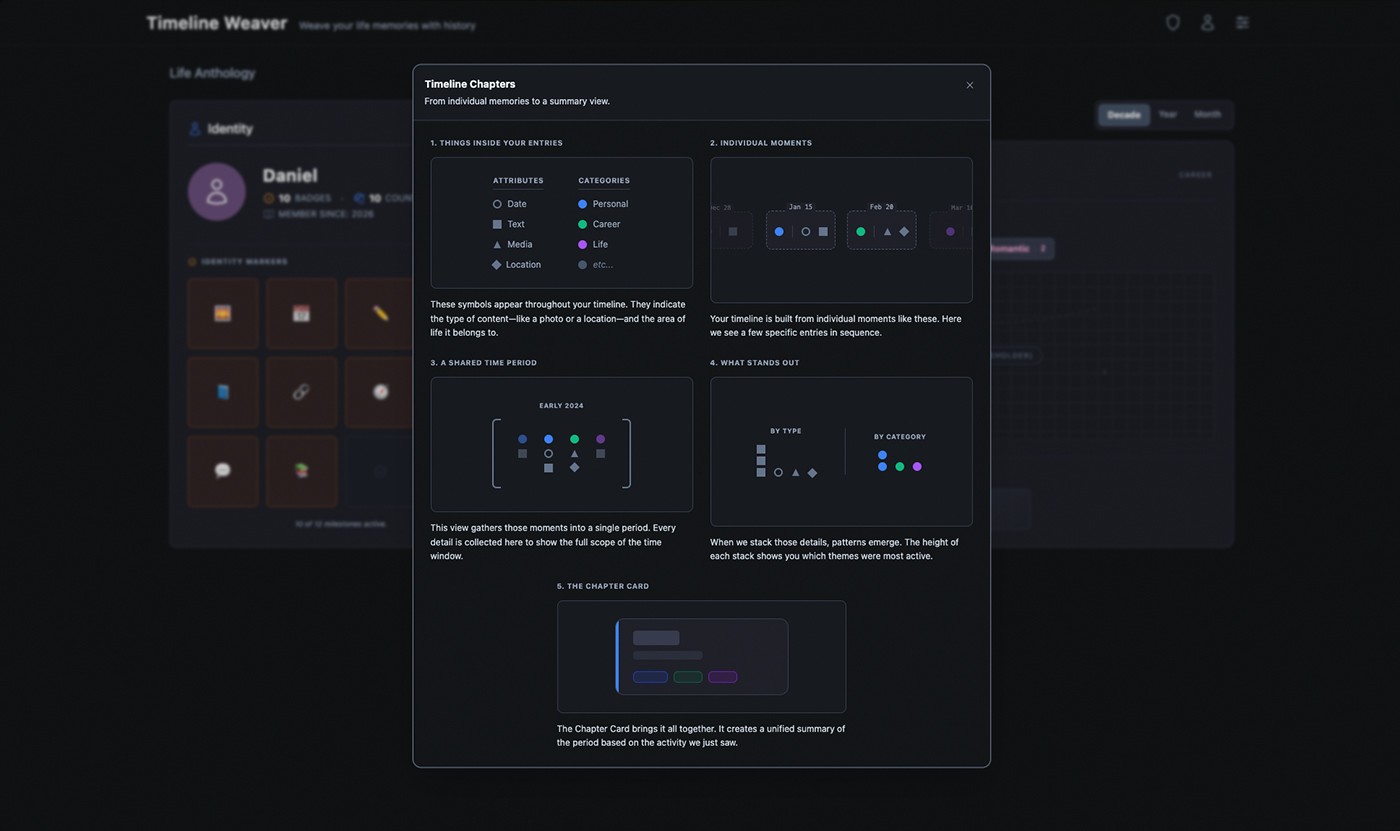
FigThe Life Anthology view lets users step back from individual entries to see how moments group into chapters — with identity markers, decade-level breakdowns, and pattern summaries that surface meaning without reorganization.
Long-term use required more than a well-structured data model — it required a motivation layer that encouraged return without relying on pressure, streaks enforced through guilt, or rewards disconnected from meaning. The Octalysis framework, built around 8 Core Drives of human motivation, was used to analyze and shape the engagement design.
The analysis informed a deliberate weighting toward white-hat drives — Epic Meaning, Empowerment of Creativity, and Ownership — while avoiding black-hat mechanics that create short-term compliance at the cost of long-term trust. This profile was made inspectable and adjustable through the Octalysis Builder, allowing engagement profiles to be tuned against specific timeline behaviors.
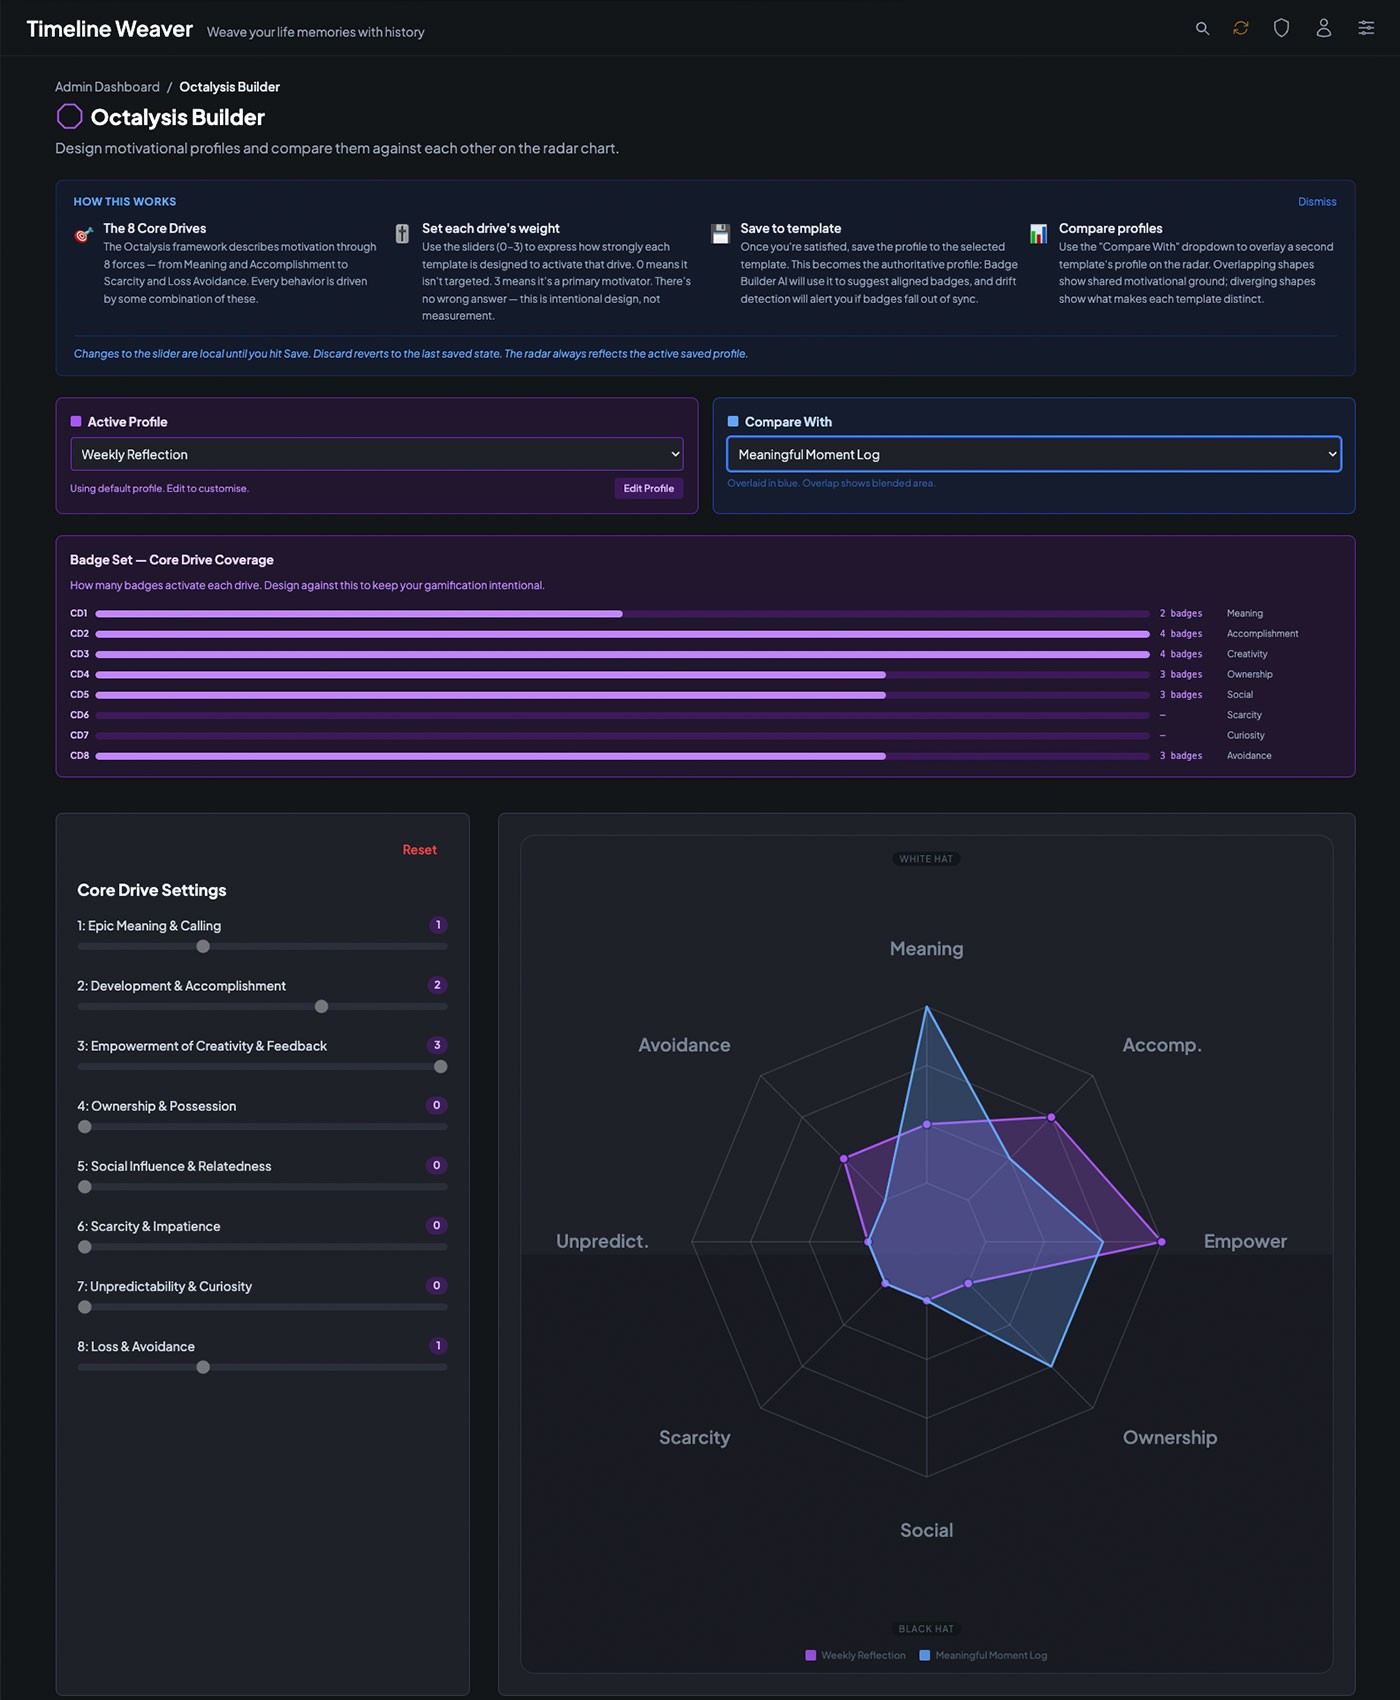
FigThe admin layer enables precise control over engagement design — mapping motivational profiles and defining achievement conditions grounded in the Octalysis framework.
The Gamification Template system translated the Octalysis framework into concrete, configurable mechanics. Each template — Daily Check-in, Weekly Reflection, Habit Streak Builder, and others — packaged a proven engagement pattern with a defined motivational profile, included mechanics, and drive composition breakdown. This allowed the engagement layer to be applied consistently without requiring manual configuration for every user.
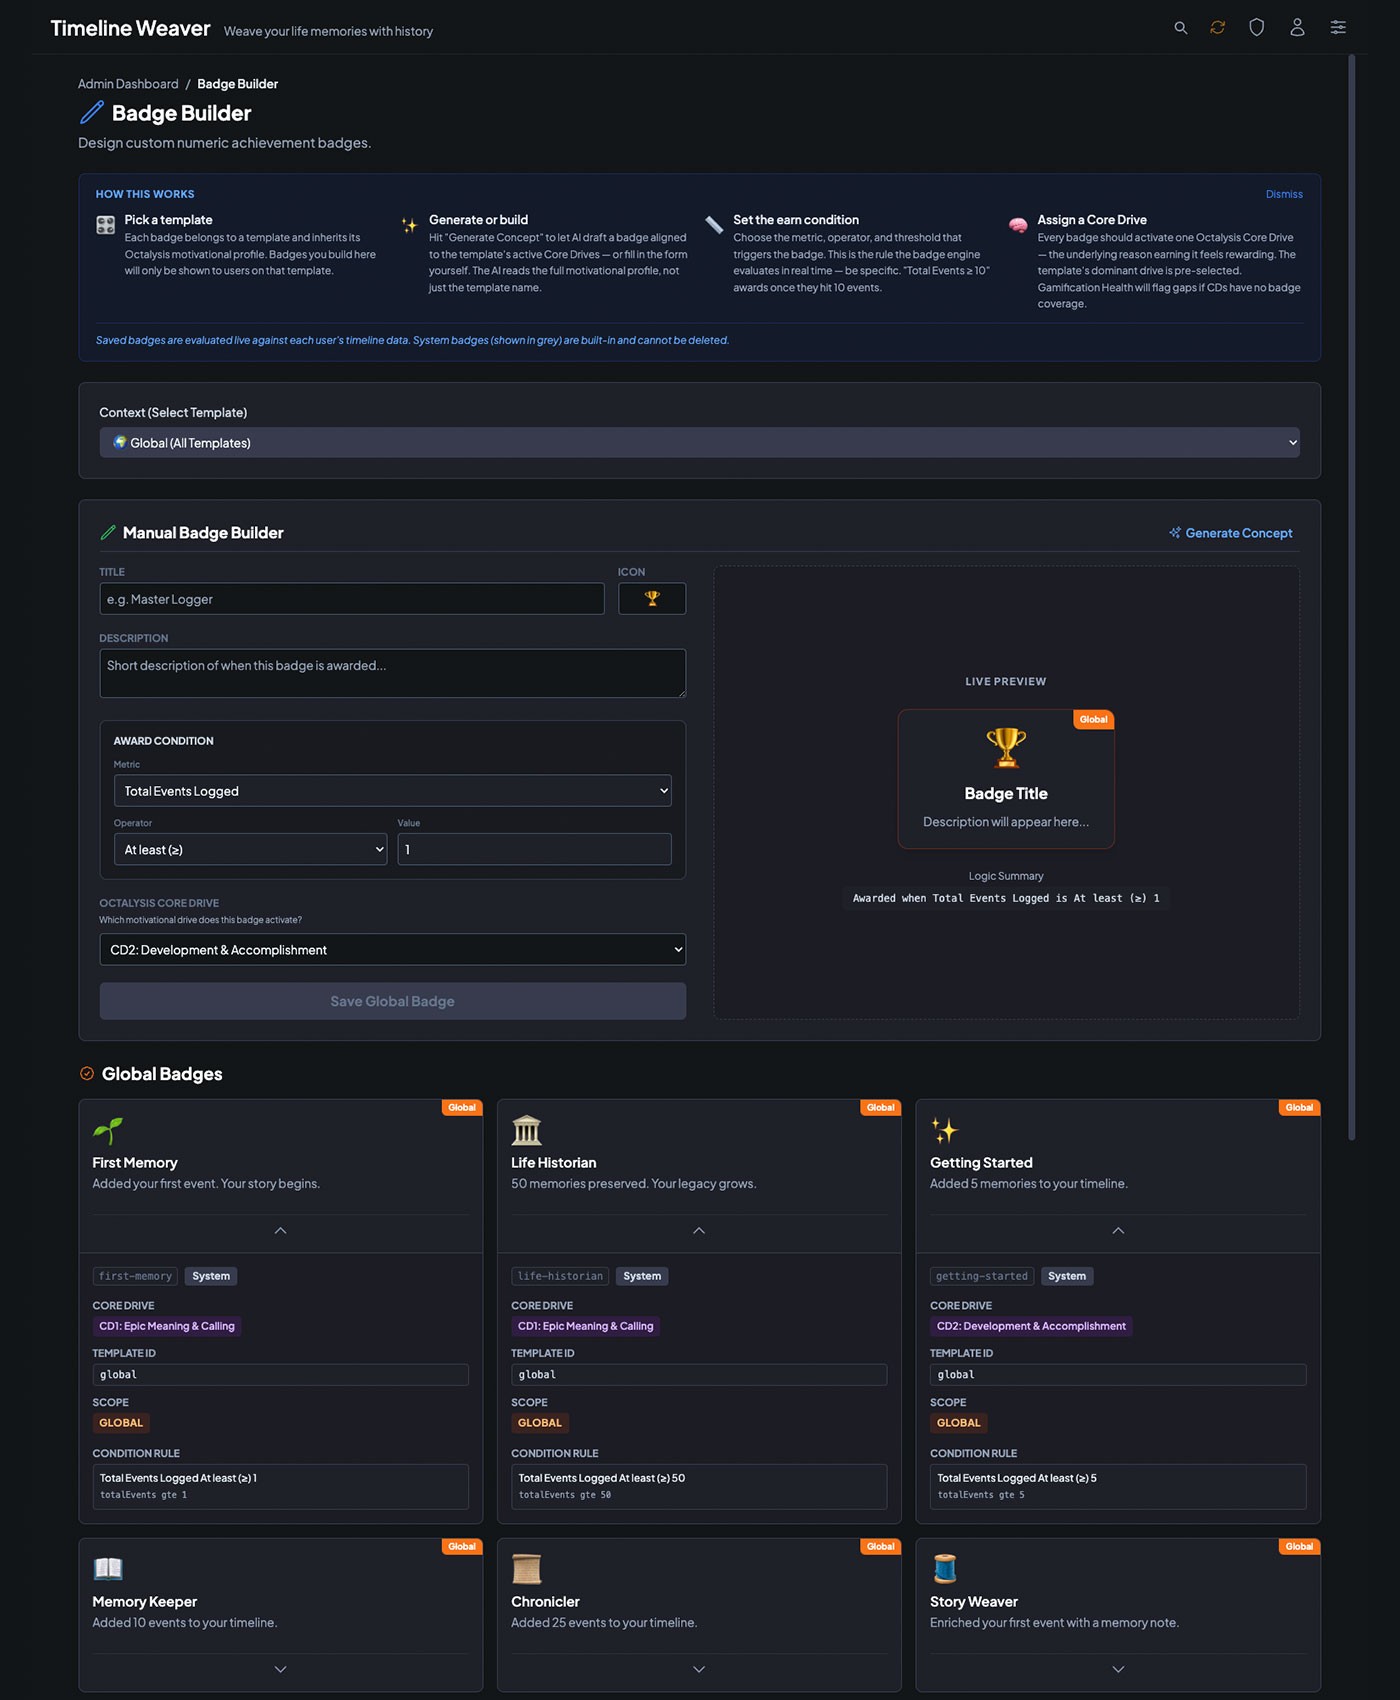
Badges extended this system at the individual entry level, providing achievement conditions grounded in actual system usage rather than arbitrary milestones. Custom badge logic could be authored through the Badge Builder and attached to any template, giving administrators control over what behaviors the system recognized and rewarded.
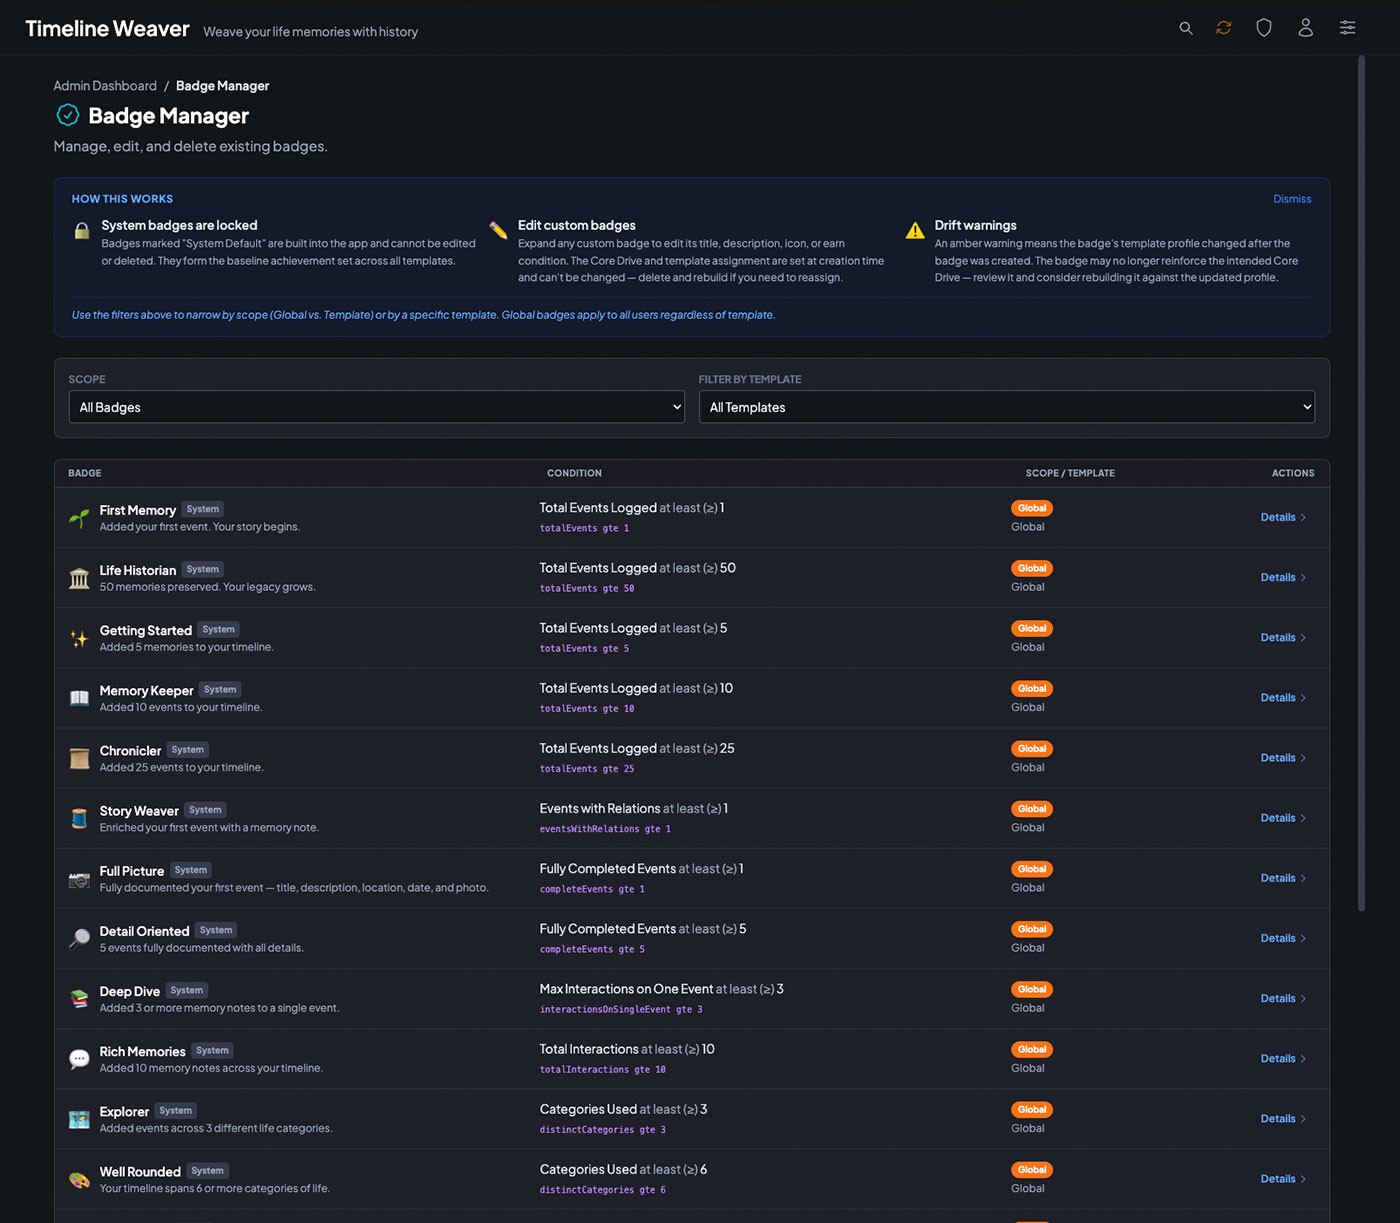
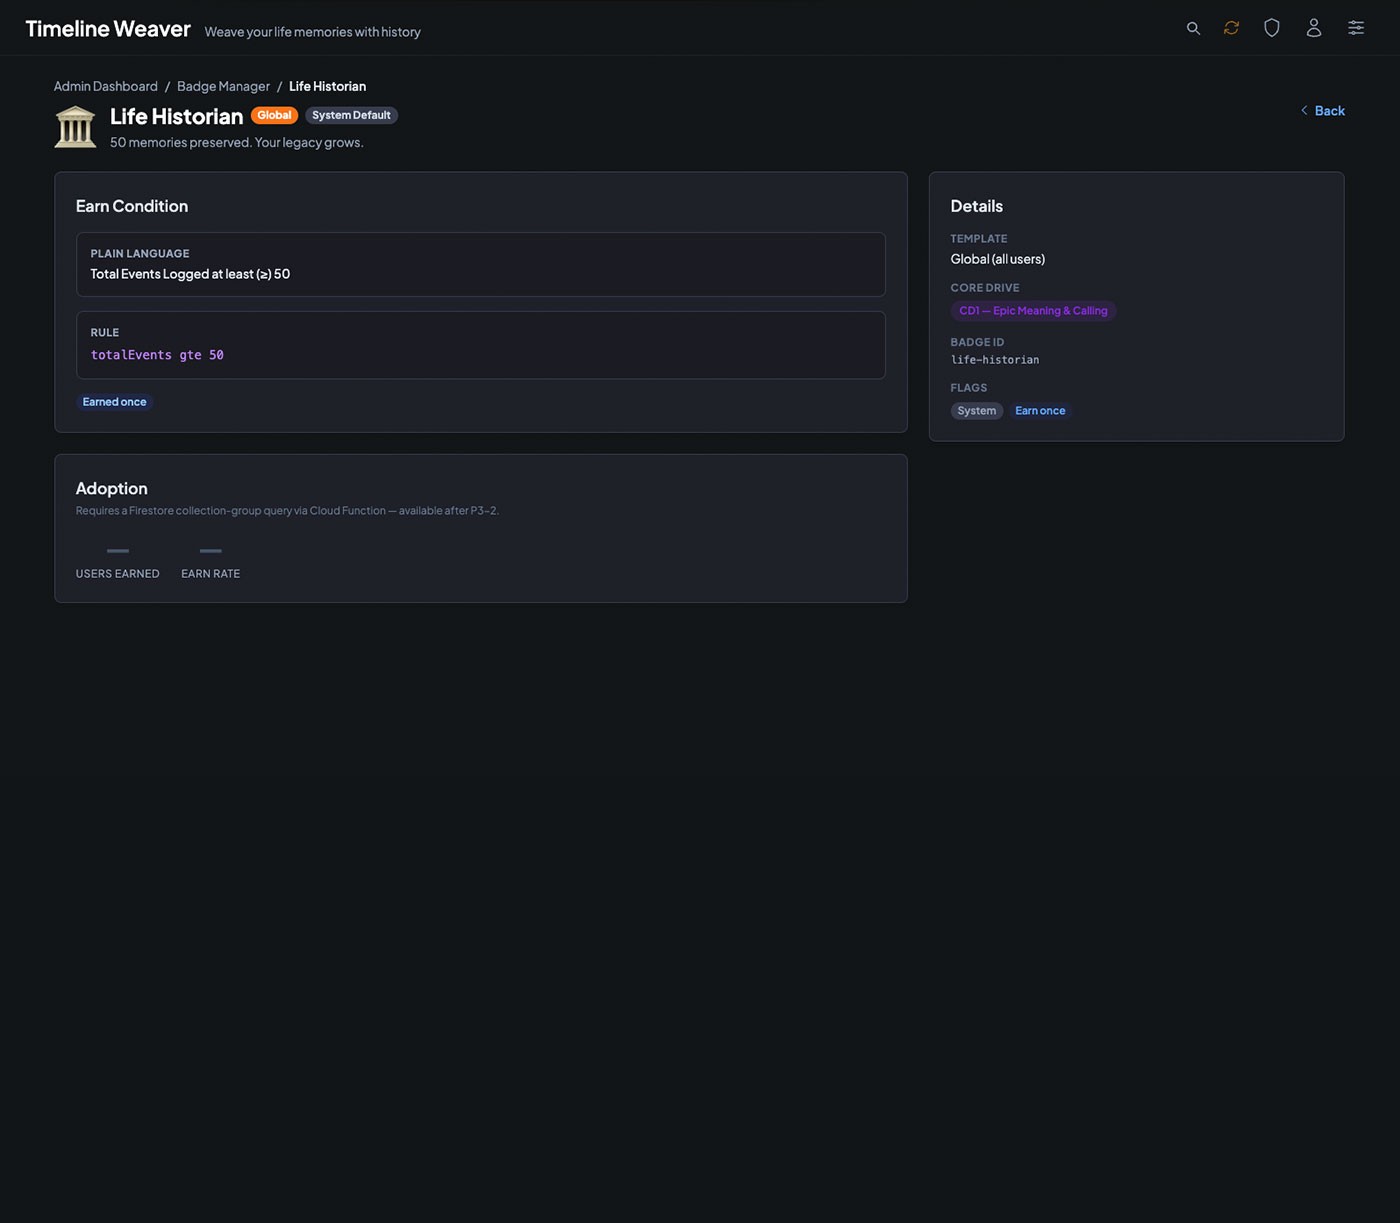
FigBadge Manager — the admin tooling for creating and maintaining the badge library. Each badge exposes its earn condition, drive assignment, scope, and adoption metrics, giving the system full observability over its engagement layer.
This project reinforced that AI tools respond best to intent, not instructions. Clearly defining goals, constraints, and expected outcomes — rather than prescribing implementation details — produced more coherent results and reduced downstream correction. This approach proved transferable across tools and complexity levels.
By defining temporal models, data relationships, interaction rules, and diagnostics before refining interfaces, the system remained flexible as it evolved. Changes could be introduced with limited side effects, allowing the product to grow without destabilizing connected components.
AI significantly compressed effort in planning, scaffolding, and front-end execution, but required continuous supervision. Staged prompts, clear constraints, and periodic audits were necessary to prevent drift and ensure the system stayed aligned with its original intent.
The transition from a localStorage prototype to a real backend required the same system-first thinking applied to the product itself. Infrastructure was introduced in phases, each independently verifiable before the next was started. Deferring this layer until the data model stabilized proved its value — migrating a well-defined data shape is straightforward. Migrating a shifting one compounds cost at every step.